Fig. 2.
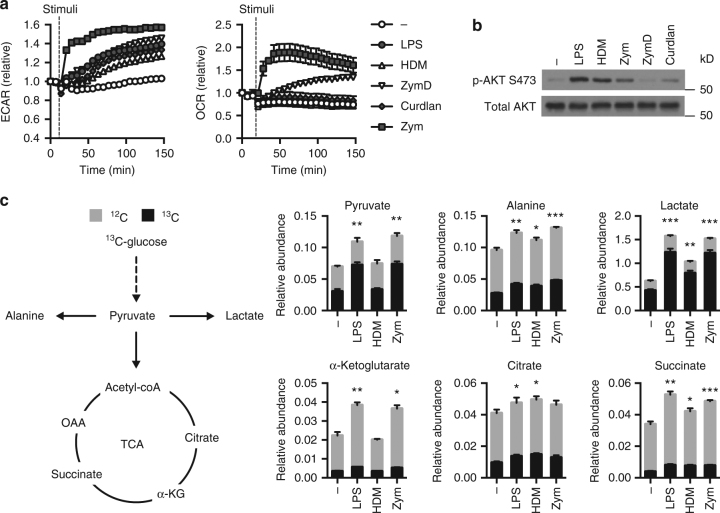
Weakly activated DCs undergo early glycolytic flux. a Indicated stimuli were injected onto DCs using the Seahorse Bioanalyzer and ECAR (left) and OCR (right) were measured in real-time. b Immunoblot for total AKT and AKT phosphorylated at Ser473 in DCs following 1 h of stimulation. c The relative abundance of various metabolites determined by GC-MS after activation for 2 h and pulse with 13C-glucose. Data shown are one experiment representative of (a) more than three experiments, (b) three experiments, and (c) two experiments (mean and s.e.m. of 9 (unstimulated) or 10 (stimulated) replicates (a) or triplicates (c)). Statistical analysis shown in c is for the comparison of the 13C-labeled fraction between each condition and the control condition using unpaired t-tests. ***p < 0.001, **p < 0.01, *p < 0.05

