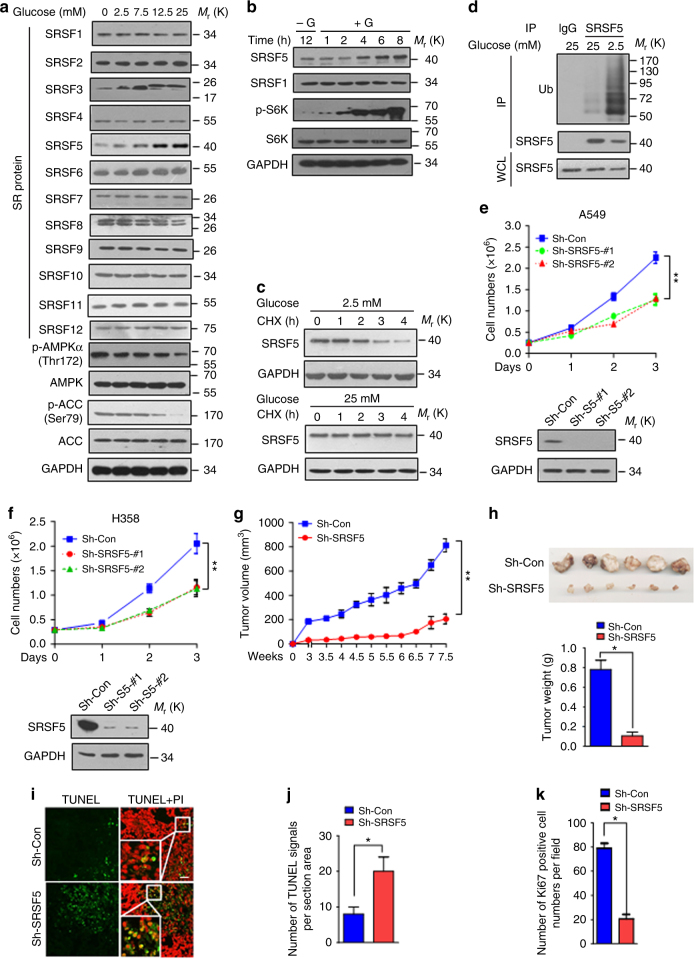
Fig. 1.
SRSF5 is stabilized at high glucose to promote tumorigenesis. a A549 cells were cultured in medium containing glucose with indicated concentration for 18 h. Lysates were subjected to immunoblotting analysis with the SRSF antibodies. AMPK and ACC were analyzed as controls. b A549 cells were glucose-starved for 12 h and then stimulated with glucose (25 mM) for the indicated times. Cell lysates were subjected to immunoblotting. c A549 cells maintained in 25 or 2.5 mM glucose were treated with cycloheximide (10 μg/ml) for the indicated times. SRSF5 protein level was analyzed by immunoblotting. d A549 cells were maintained at indicated concentration of glucose. Cells were harvested for ubiquitylation analysis. A549 cells (e) and H358 cells (f) were transfected with shRNA-SRSF5 or random shRNA by a lentivirus system. Cell numbers were determined by a cell counter at indicated times (upper panel) and the expression level of SRSF5 was determined by immunoblotting (lower panel). (**P < 0.01, two-way ANOVA test). g Tumor growth curves in nude mice. The indicated stable cell lines were collected and subcutaneously injected into nude mice. Tumor diameters were measured twice a week and tumor volume were calculated. Each point represents the mean volume ± s.e.m., n = 6 mice per group (**P < 0.01, Mann–Whitney test). h Tumor weight. All the tumors derived from indicated cells were shown and tumor weight was measured. Results are shown as mean ± s.e.m. of tumor weights (n = 6, each with initial six injections) (**P < 0.01, Mann–Whitney test). i Tumors shown in h were formalin-fixed, paraffin-embedded, and sliced for TUNEL assay. Representative images of indicated TUNEL staining are shown. The boxed areas in the right images were magnified on the left. Scale bar, 50 μm. Quantification of positive signals of TUNEL (j) or Ki67 (k) from indicated groups based on n = 100 cells assessed from six fields in h were shown. (*P < 0.05, one-way ANOVA test). Data are representative of three independent biological replicates (e, f; mean and s.e.m., n = 3). Unprocessed original scans of blots are shown in Supplementary Fig. 9

