Fig. 2.
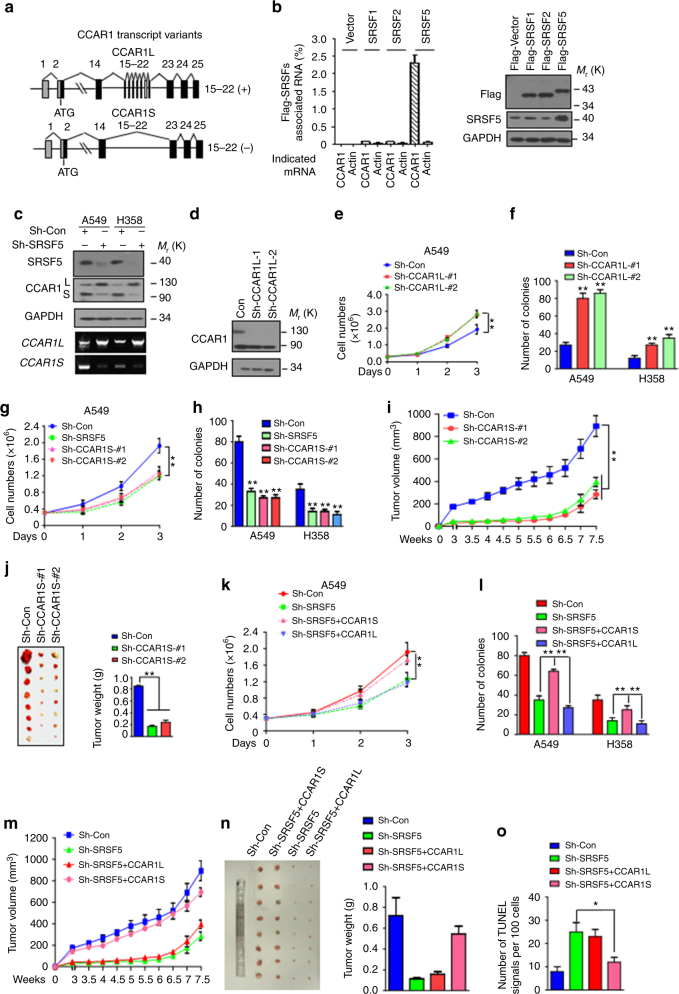
SRSF5 controls CCAR1 splicing to regulate tumor cell growth. a Schematic diagram of CCAR1 splice variants. b In vivo ultraviolet cross-linking and immunoprecipitation (CLIP) from cells transfected with indicated plasmids were subjected to qPCR analysis with specific primers (left panel). Expression of each protein was confirmed by immunoblotting (right panel). c Depletion of SRSF5 leads to a shift of CCAR1 splicing module in A549 and H358 cells. d CCAR1L knockdown efficiency in A549 cells was assessed by immunoblotting analysis. e Cell proliferation assay of cells as in d (**P < 0.01, two-way ANOVA test). f Quantification of clonogenic formation assay of indicated cells. g Reduced proliferation in the absence of CCAR1S in A549 cells. Cell proliferation assay was performed as in e, cells stably expressing shRNA-SRSF5 was introduced for comparison. h Reduced clonogenic formation ability in the absence of CCAR1S in A549 and H358 cells. i CCAR1S depletion delays tumor growth in nude mice. Tumor diameters were measured at indicated time points to calculate tumor volume. Each point represents the mean volume ± s.e.m. (**P < 0.01, Mann–Whitney test). j CCAR1S depletion shrinks tumor growth in nude mice. All the tumors were shown (left) and measured (right). Results are shown as mean ± s.e.m. of tumor weights (**P < 0.01, Mann–Whitney test). k Cell proliferation assay were conducted in A549/sh-SRSF5 cells re-introduced with CCAR1L, CCAR1S, and control vectors. l Quantification of the number of colonies for A549 cells or H358 cells. m CCAR1S re-introduction in SRSF5-depleted cells enhanced tumor growth in nude mice. Data were collected and displayed as in i (*P < 0.05, Mann–Whitney test). n CCAR1S re-introduction in SRSF5-depleted cells displays enhanced tumor weight. Data were collected and displayed as in j (**P < 0.01, two-way ANOVA test). o Quantification of the TUNEL signals of tumor sections in n is shown. n = 100 cells from three fields were assessed (*P < 0.05, one-way ANOVA test). Data are representative of three independent biological replicates (e–h, k, l; mean and s.e.m., n = 3). Unprocessed original scans of blots are shown in Supplementary Fig. 9

