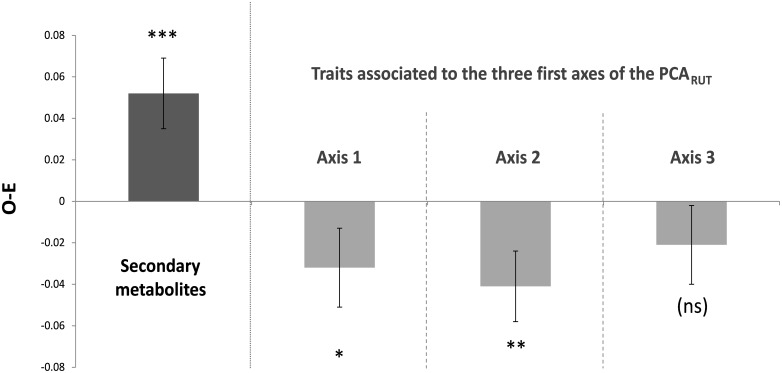
FIGURE 1.
Results of the within-plot functional dissimilarity analyses. O-E: mean (±SD) of the 1000 values obtained by calculating the median of the difference (among the 19 plots) between the observed and expected functional dissimilarity. Asterisks indicate whether O-E was significantly positive or negative, or neither of both (ns). ∗p ≤ 0.05, ∗∗p ≤ 0.01, ∗∗∗p ≤ 0.001. “axis 1” means that Euclidean distances were computed using resource use traits that were significantly correlated with the first axis of the PCARUT (idem for axes 2 and 3).

