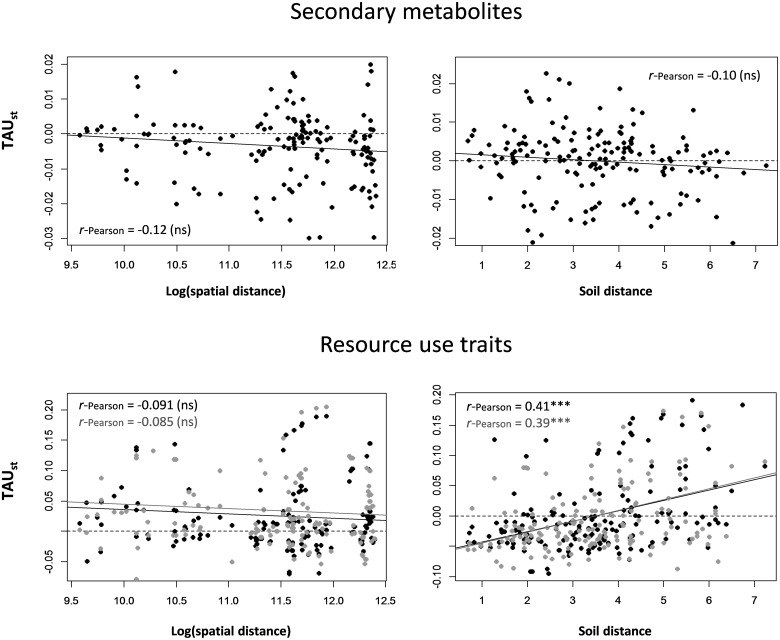
FIGURE 2.
Functional turnover among all pairs of plots (TAUst), calculated for secondary metabolites and resource use traits, plotted against spatial distance (log-transformed) and soil distance (after removing spatial effect) between plots. For resource use traits, black and gray dots correspond to TAUst values calculated using traits that were significantly correlated with axes 1 and 2 of the PCARUT, respectively. Correlation values between TAUst and spatial/soil distance are represented in each graph. Asterisks indicate whether the Mantel test of each correlation was significant (∗∗∗P ≤ 0.001) or not (ns). Soil distance was calculated using the five soil variables (C/N, P, NO3–, K, Ca) that were significantly correlated with the first axis of the PCAsoil.

