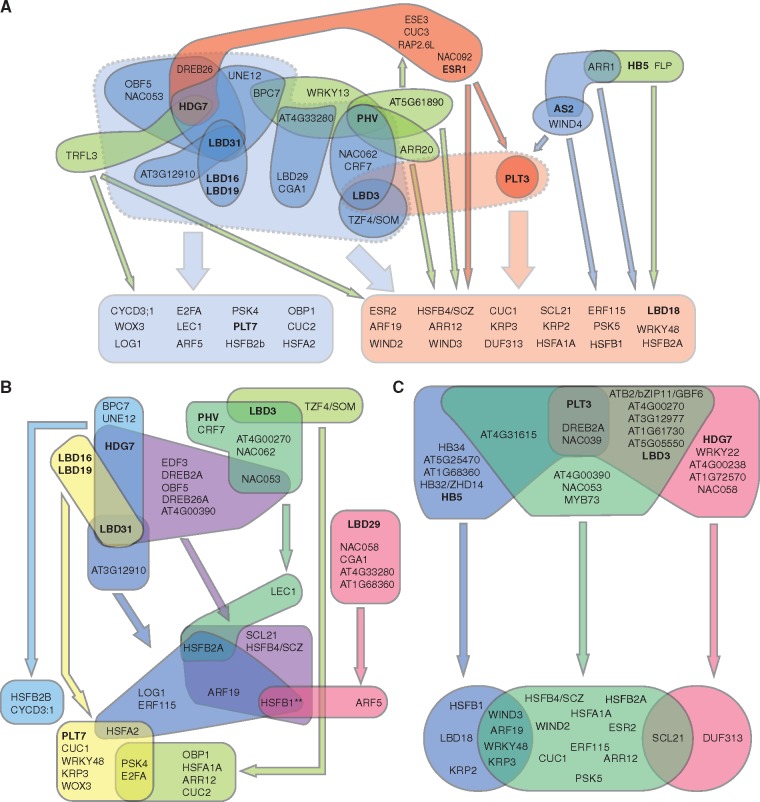
Fig. 2.
A power graph of the cellular reprogramming GRN. (A) A simplified representation of a subset of 34 power edges identified in the GRN for plant cell reprogramming using the power graph compression. All power nodes containing members of the LOB/AS2 TFs (colored in blue), HB TFs (colored in green), PLT3 and ESR1 (colored in red), representative of the AP2/ERF TFs, are shown, since they best explain the group structure of the power nodes based on the MCA. For simplicity, three PLT3 power nodes are represented as a single node, and all accompanying TFs, except for HB TFs, in the PLT3 power nodes that overlap with the LOB/AS2 power nodes are not shown. The target promoters are divided into two groups, depending on whether they interact with LOB/AS2 power nodes (colored in light blue) or primarily with PLT3 power nodes (colored in light red). Power edges between the nodes and these two promoter classes are represented by thin arrows, with colors corresponding to their regulatory nodes. Dotted, shaded collections of power nodes indicate the two main regulatory modules, the LOB/AS2-regulatory module (marked in light blue) and the PLT3-regulatory module (marked in light red), and thick arrows indicate their interaction with the promoters. See also Supplementary Table S7 for the full list of represented and non-represented genes. (B) (C) Detailed power edges within the LOB/AS2 (B) and PLT3 (C) regulatory modules, with the different power nodes and their power edges marked by the same colors. TFs belonging to the LOB/AS2 or HB TF classes and PLT3 and ESR1 are shown in bold.

