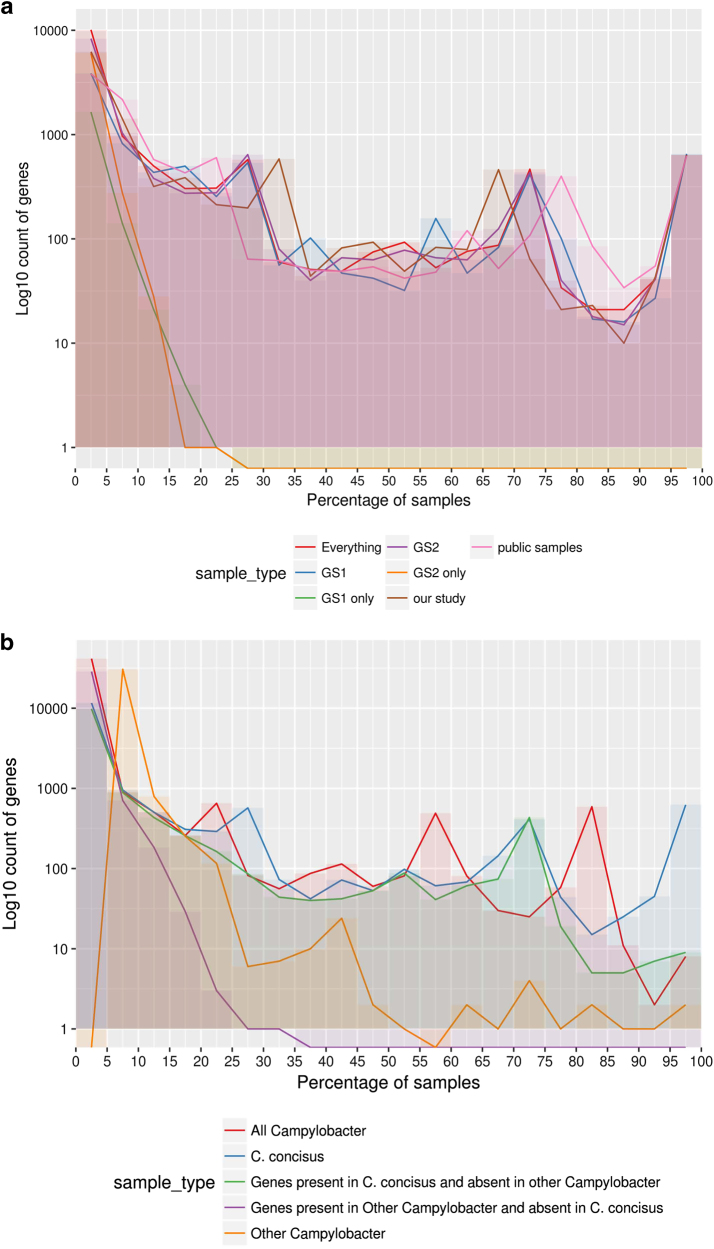
Fig. 4.
a Pangenome summary of all C. concisus used in this study. The figure displays the number of genes found to be shared across a certain percentage of samples in different groupings of isolates. This figure uses a bin size of 5% on the x-axis. GS Genomospecies, and b Pangenome summary of all Campylobacter. This was produced by carrying out pangenome analysis of all the C. concisus isolates and one reference assembly for each non-C. concisus species that was available. The figure displays how many genes were found to be shared across a certain percentage of samples in different groupings of isolates. The figure depicts a bin size of 5% on the x-axis

