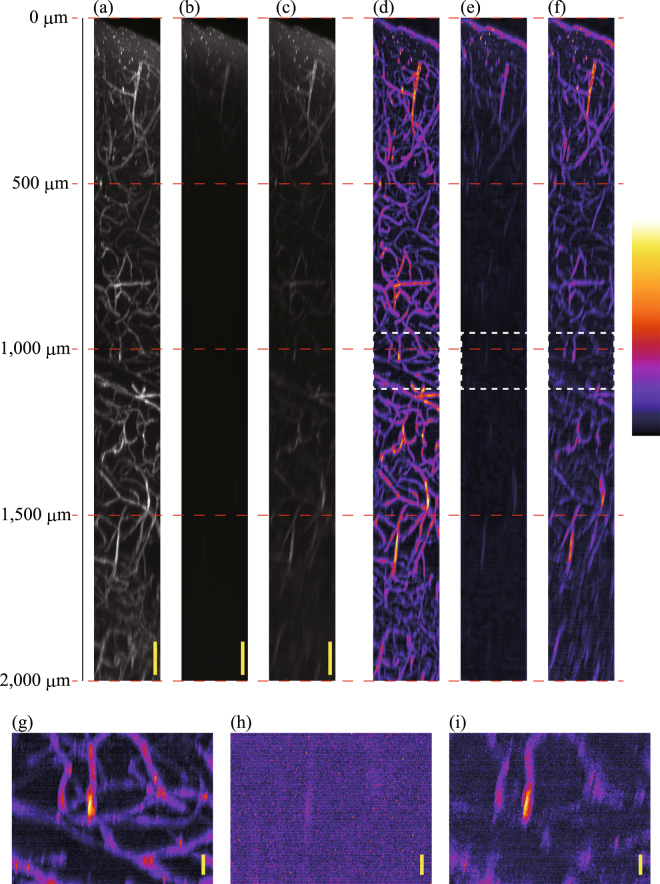
Figure 6.
Observation results of blood vessels in a mouse cerebrum. (a)–(c) -projected images for an optical depth of 0 μm to 2,000 μm from scans performed with wavefront modulation using the ACMSS, with wavefront modulation using the SACM, and without wavefront modulation, respectively. (d)–(f) False-colour images with gamma correction and background subtraction of (a–c). (g–i) Magnified -projected images from 950 to 1,100 μm. Scale bars indicate 100 μm in (a–c), and 20 μm in (g–i).

