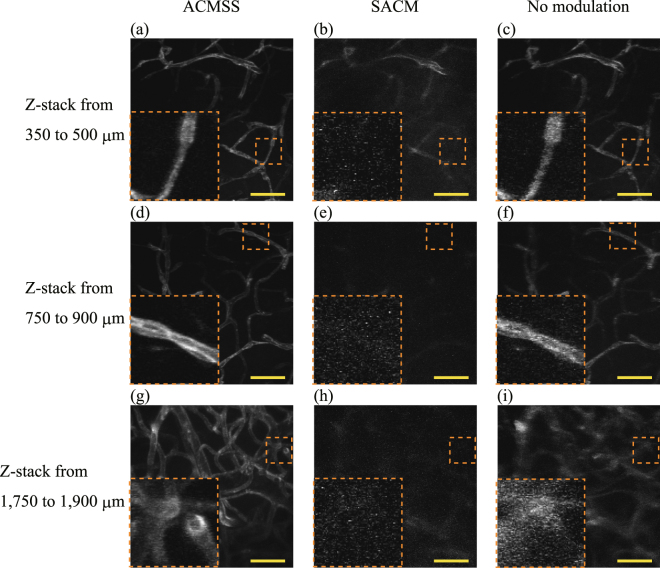
Figure 8.
Maximum-intensity z-projection images. (a–c) z-projection images from an optical depth of 350 μm to 500 μm from the scan performed with wavefront modulation using ACMSS, with wavefront modulation using SACM, and without wavefront modulation, respectively. (d–f) - projection images from 750 μm to 900 μm. (g–i), - projection images from 1,750 μm to 1,900 μm. Scale bar indicates 50 μm. Magnified views of the vessels in the orange dashed box are shown in the lower left of (a–i). The brightness of each image is normalised using the maximum fluorescence intensity of each image after background-noise subtraction.

