Figure 2.
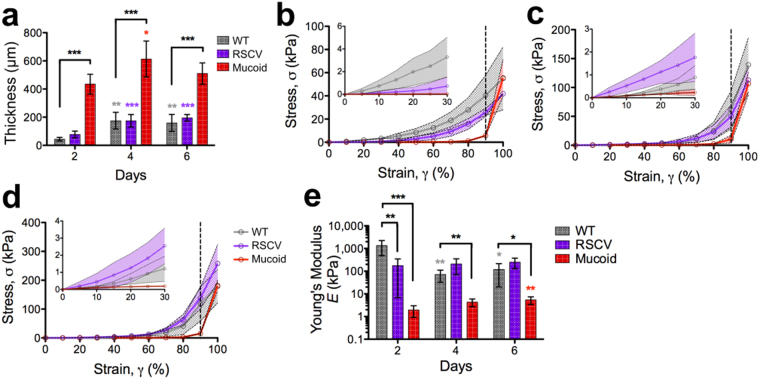
Mucoid colony-biofilms are softer than WT. (a) Thicknesses of colony-biofilms determined from the uniaxial compression measurement. Stress-strain curves of (b) 2-d, (c) 4-d and (d) 6-d P. aeruginosa colony-biofilms from uniaxial compression measurements. The dotted black line at 90% strain (γ) indicates where the underling filter likely influenced the data. The inset depicts the region of the curve from 0–30% strain (γ). Legend depicted in (d) is equivalent for (b) and (c). (e) Young’s modulus of the lower linear portion of the force-displacement curve, corresponding to 0–30% strain (γ). Data presented as mean ± SD; n = 6. Black * indicates comparisons depicted by the line. Coloured * indicates comparisons to 2-d of the given biofilm. *p-value < 0.05, **p-value < 0.01, ***p-value < 0.001.

