Figure 3.
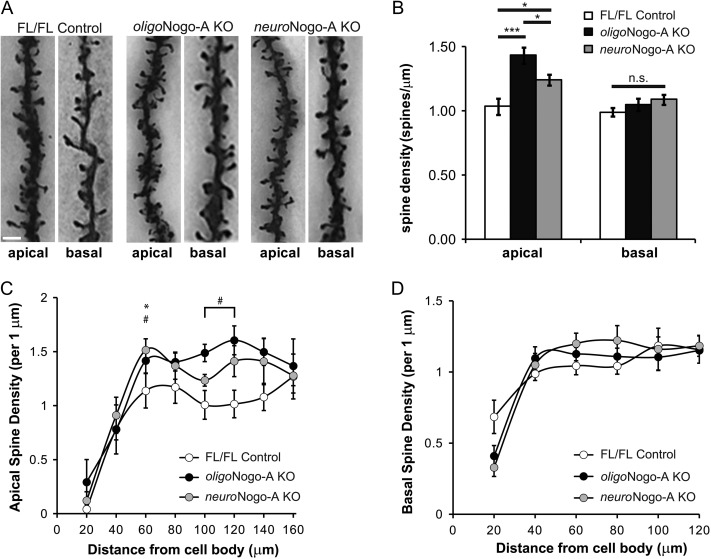
Spine density in motor cortex layer 2/3 pyramidal cells of neuroNogo-A KO and oligoNogo-A KO mice. (A) Representative examples of Golgi-impregnated apical and basal dendrites from FL/FL control, oligoNogo-A KO mice and neuroNogo-A KO mice. (B) Spine density is significantly increased in apical but not basal dendrites in both KO lines with a stronger effect in oligoNogo-A KO mice (n = 15 cells for FL/FL control, n = 15 cells for oligoNogo-A KO, n = 16 cells for neuroNogo-A KO from 4 animals per condition). (C, D) Higher dendritic spine density is seen in the more distal parts of apical (C) but not basal (D) dendrites in both KO lines with a stronger effect in oligoNogo-A KO mice. Calibration bar: 2 μm in (A). Data are presented as mean ± SEM. #P < 0.05 oligoNogo-A KO versus FL/FL, *P < 0.05 neuroNogo-A KO versus FL/FL.

