Figure 4.
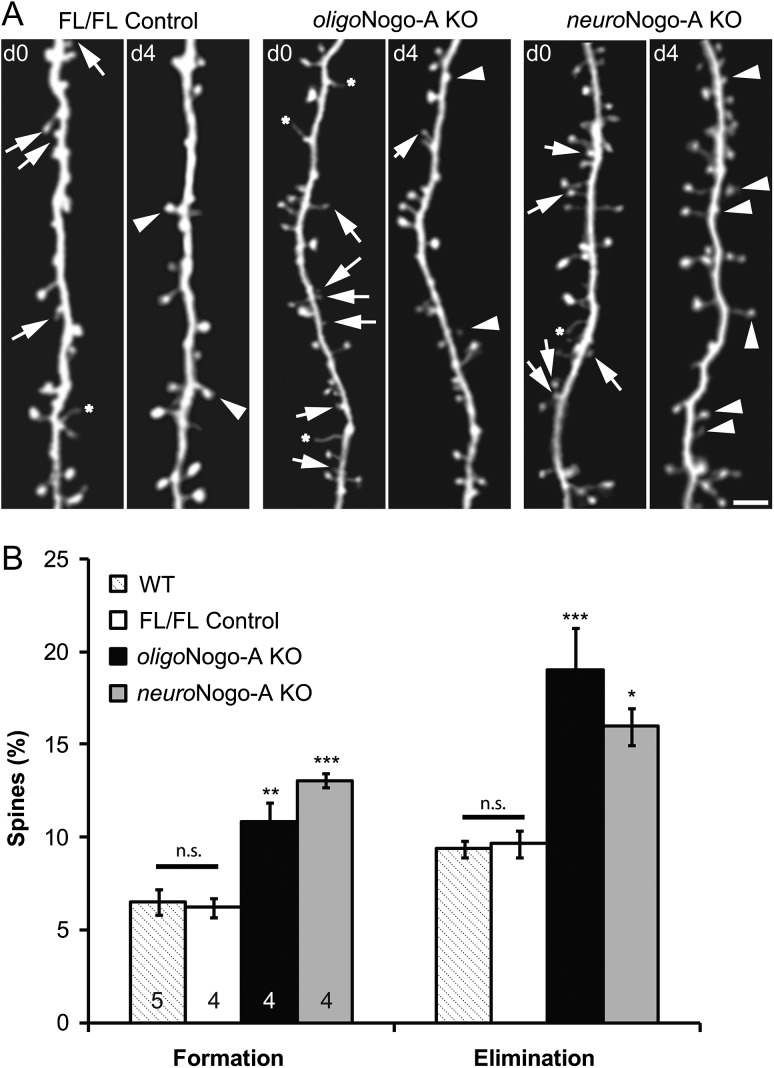
Dynamic spine turnover in neuroNogo-A and oligoNogo-A KO mice. (A–C) Repeated two-photon in vivo imaging of the same motor cortex layer 5 dendritic segments at day 0 (d0) and day 4 (d4) reveals formation of new spines (arrowheads), spine elimination (arrows), and filopodia (stars) in control (A), oligoNogo-A KO (B), and neuroNogo-A KO (C) adult mice (6–8 weeks of age). Scale bar, 2 um. (D) Percentage of dendritic spines that are newly formed or eliminated over 4 days (n = 5 animals for WT control, n = 5 animals for FL/FL control, n = 4 animals for oligoNogo-A KO, n = 4 for neuroNogo-A KO; mean ± SEM. *P < 0.05, **P < 0.01, ***P < 0.001).

