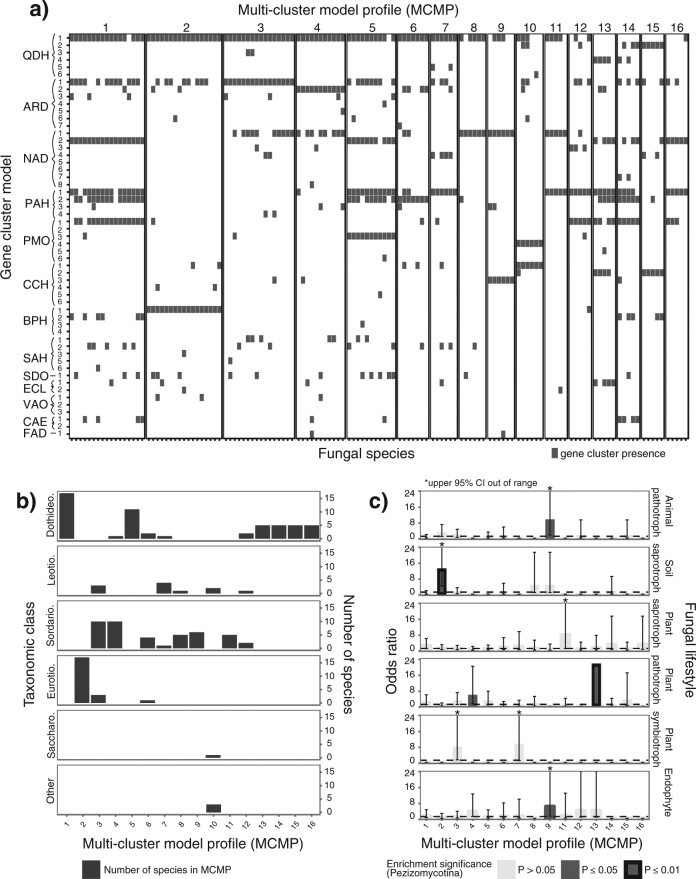
Fig. 2.
Combinations of candidate phenylpropanoid-degrading gene clusters in fungal genomes. a A matrix describes the presence/absence of various homologous clusters (as determined by cluster model; rows) in the genomes of 133 fungal species (columns). Species are grouped into 16 multi-cluster model profiles (MCMPs) based on similarities in the combinations of clusters found in their genomes. b A bar chart depicts the number of fungal species from each MCMP per taxonomic class. c Odds ratios representing the strength of the association between MCMP and fungal ecological lifestyle are shown, using data at the species level from the Pezizomycotina. Dotted black lines indicate an odds ratio of 1. Dark gray bars indicate enrichment below a significance level of 0.05, whereas black outlines indicate enrichment below a significance level of 0.01. Error bars indicate the 95% confidence interval (CI) for each odds ratio measurement. CIs of 0 are not shown. Enrichment data are not shown for MCMP 10, as fewer than five fungi from the Pezizomycotina are assigned to this MCMP.

