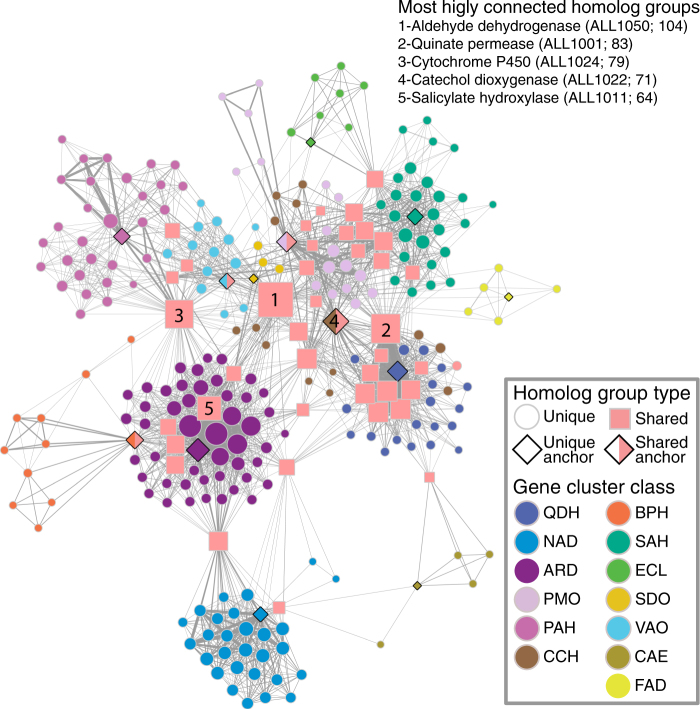
Fig. 3.
Co-occurrence network of homolog groups in candidate phenylpropanoid-degrading gene clusters. Each node represents a homolog group found in a candidate phenylpropanoid-degrading gene cluster. All nodes are color-coded by the cluster class in which they are found, except for those homolog groups found associated with multiple cluster classes (i.e., “shared”), colored pink and shaped as squares. Nodes representing anchor gene families used to retrieve the clusters are shaped as diamonds, and those anchor gene families that are shared across multiple cluster classes are additionally colored pink. Edges symbolize the co-occurrence of two homolog groups in the same gene cluster, whereas edge width is proportional to the frequency of that occurrence. Node size is proportional to the number of connections emanating from that node. The proximity of nodes to one another is proportional to the number of shared connections. The annotations, followed by the code names and number of unique connections in parentheses, of nodes with the greatest number of connections (i.e., associated with the greatest diversity of homolog groups) are indicated in the top right-hand corner of the network.

