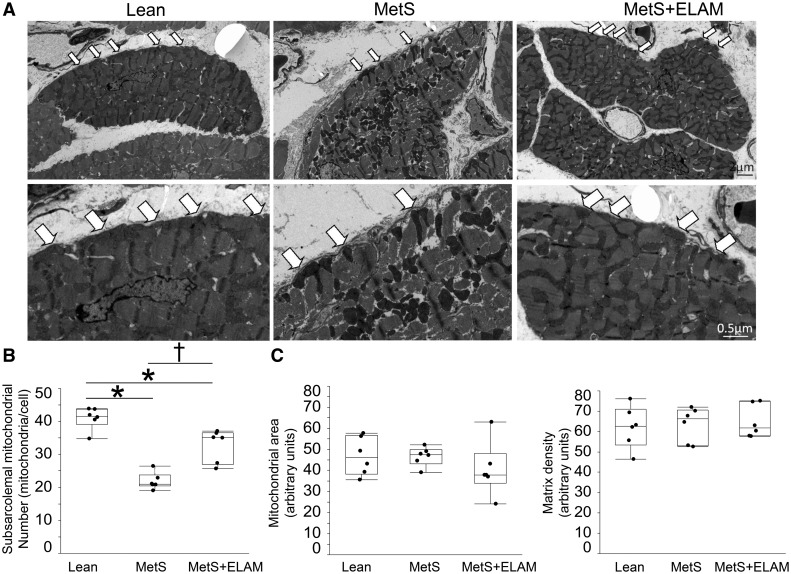
Figure 2.
Mitoprotection restored subsarcolemal mitochondrial density. (A) Representative transmission electron microscopy images of cross-sectioned cardiomyocytes showing distribution of mitochondria. (B) The number of subsarcolemal mitochondria (arrows) was lower in MetS compared to Lean, but increased in MetS + ELAM (n = 6/group). (C) Mitochondrial area and matrix density did not differ among the groups (n = 6/group). *P < 0.05 vs. lean, †P < 0.05 vs. MetS + ELAM.

