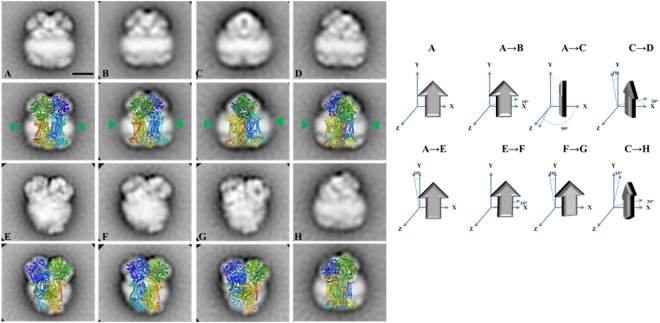
Figure 6.
2D Projection maps of purified dimeric complex III from E. gracilis obtained by single particle averaging. The dimeric complex III was purified by a two-step chromatographic procedure in the presence of β-dodecyl-n-maltoside and analyzed by EM. Overlap of the chicken dimeric complex III (pdb: 4U3F63) over the EM images was performed. (A–D) side view projections, (E–H) slightly tilted side-view. The membrane region is indicated by the green arrow heads. At the right: schematic representation of the rotation of the complex in the left panels. The approximate rotation angles over the axis are indicated. The scale bar is 10 nm.

