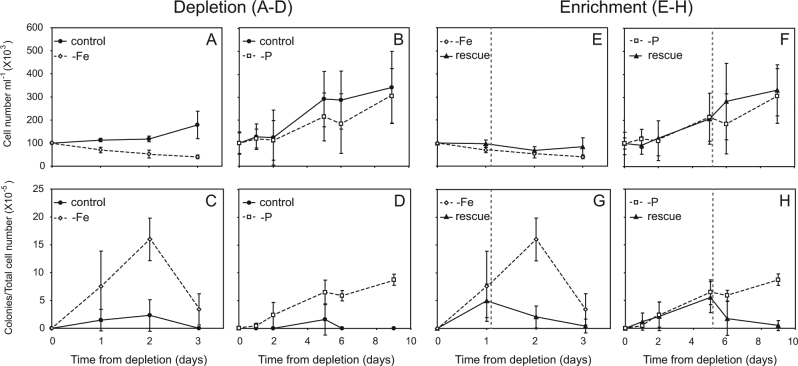
Fig. 5.
Daily changes in total cell concentrations (a, b) and colony numbers normalized to total cell numbers (c, d) of exponentially growing nutrient replete (filled circles) T. erythraeum IMS101 cultures that were transferred to either Fe-depleted (empty diamond) or P-depleted (empty squares) media (a–d). Daily changes in total cell concentrations (e, f) and colony numbers normalized to total cell numbers (g, h) after nutrient enrichment (rescue treatment) of Fe-EDTA (e, g) or KH2PO4 (f, h) to the corresponding depleted culture that was added 24 h or 5 days (symbolized by vertical gray line) after depletion at a concentration matching Fe and P concentrations of replete YBCII. Time scale of experiments differ in the Fe-depleted vs. P-depleted cultures due to the different rates of response to the stress imposed by the limiting nutrient (n = 3 independent biological stock-cultures per treatment)

