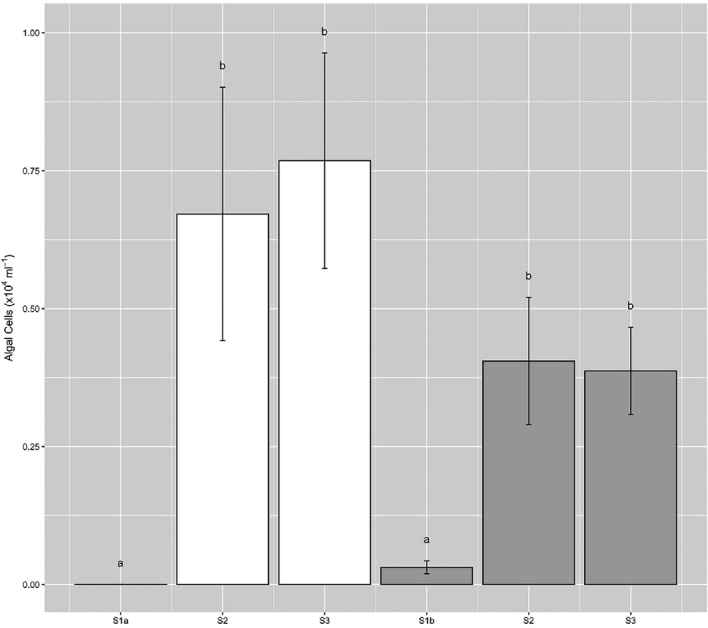
Figure 3.

Ice algal cell abundance across sampling sites during transect 1 (white bars) and transect 2 (grey bars) (mean ± SE, n = 10). Lower-case letters denote homogenous subsets determined from 1-way ANOVA analysis of algal abundance ∼ site per transect (Transect 1, F2,27 = 5.88, P < 0.01; Transect 2, F2,27 = 6.78, P < 0.01). Separate 1-way ANOVA was performed per transect given the assessment of different sites (S1a/S1b) between transects.
