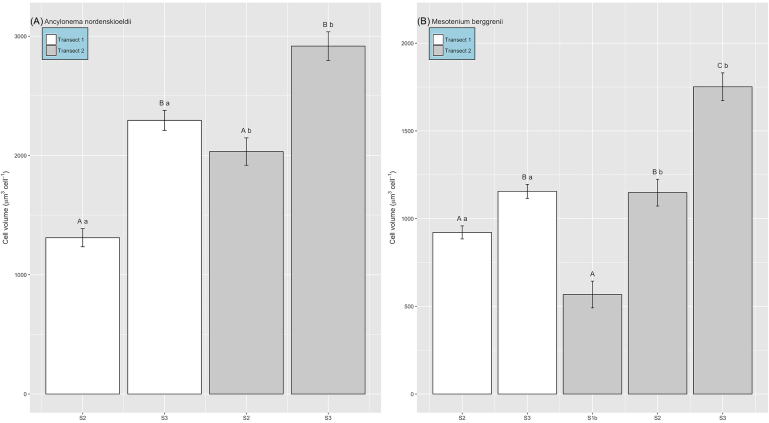
Figure 4.
Ice algal biovolume of (A) Ancylonema nordenskiöldii and (B) Mesotaenium breggrenii assessed across sampling sites during transect 1 (white bars) and transect 2 (grey bars) (mean ± SE). For A. nordenskiöldii, letters denote homogenous subsets determined from 2-way ANOVA of biovolume ∼ site (upper case letters) + transect (lower-case letters) (F1,23 = 14.98 and 20.81, respectively, P < 0.001 in both cases). For M. berggrenii, given the absence of cells at site S1a during transect 1, biovolume was compared between sites separately across transect 1 (two-sample t-test, t14 = − 3.06, P < 0.01) and transect 2 (1-way ANOVA, F2,18 = 16.7, P < 0.001), and between transects separately for sites S2 (two-sample t-test, t12 = − 2.24 P < 0.05) and S3 (two-sample t-test, t17 = −3.65, P < 0.01). Upper case letters denote homogenous subsets in relation to site, and lower-case letters in relation to transect.

