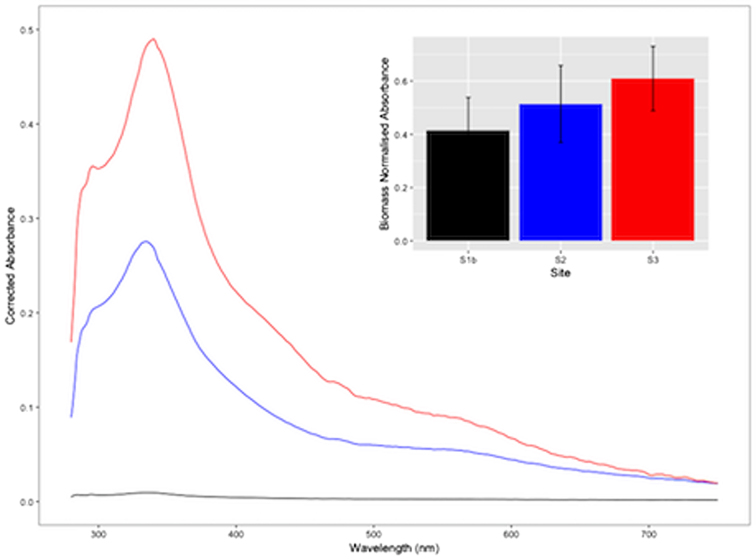
Figure 7.
Normalised absorbance spectra of water-soluble pigments derived from surface ice samples at sites S1b (black line), S2 (blue line) and S3 (red line) during transect 2. Insert shows biomass normalised absorbance maxima for the dominant peak (λ335nm) identified across spectra (mean ± SE, n = 5).

