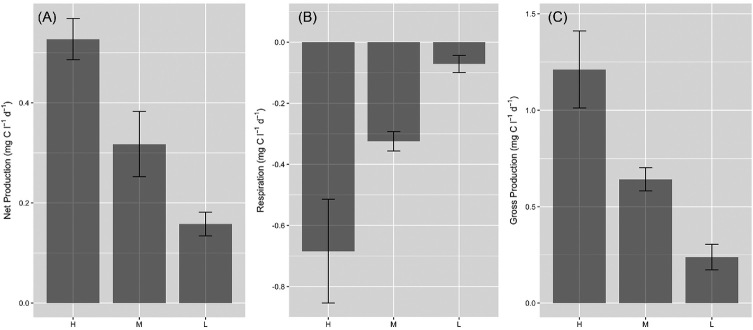
Figure 9.
Net production (A), respiration (B) and gross production (C) of surface ice containing a high (H, 3.76 ± 0.56 µg C m−1), medium (M, 1.16 ± 0.06 µg C ml−1) or low (L, 0.01 ± 0.00 µg C ml−1) biomass of ice algae (mean ± SE, n = 3). Lower case letters denote homogenous subsets in relation to biomass for each parameter as determined by 1-way ANOVA (net production, F2,6 = 15.81, P < 0.01; respiration F2,6 = 6.56, P < 0.05; gross production F2,6 = 11.05, P < 0.05). Biomass was significantly different between each biomass category (1-way ANOVA, F2,6 = 33.91, P <0.001).

