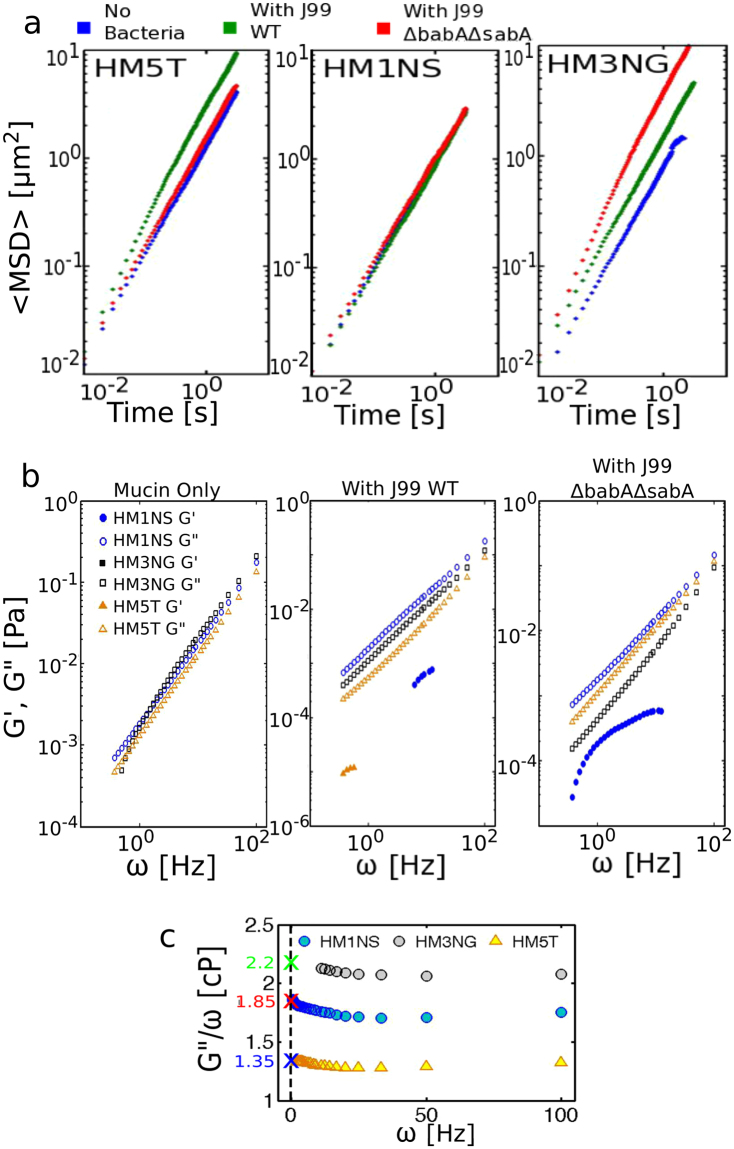
Figure 3.
Particle tracking microrheology results from different human mucin solutions at concentration of 15 mg/ml. (a) Average MSD of particles in HM5T (left panel), HM1NS (middle panel), and HM3NG (right panel) in absence of bacteria (blue), in presence of J99 WT (green), and in presence of J99ΔbabAΔsabA (red). (b) Elastic and viscous moduli, G′(ω) (filled symbols) and G′′ (ω) (hollow symbols) of HM5T (orange), HM1NS (blue), and HM3NG (black) without bacteria (left panel), in presence of J99 WT (middle panel), and in presence of J99ΔbabAΔsabA (right panel). (c) Ratio, G′′(ω)/ω, of HM1NS (blue), HM3NG (black), and HM5T (orange). Colored crosses indicate the limiting values of η at zero frequency.

