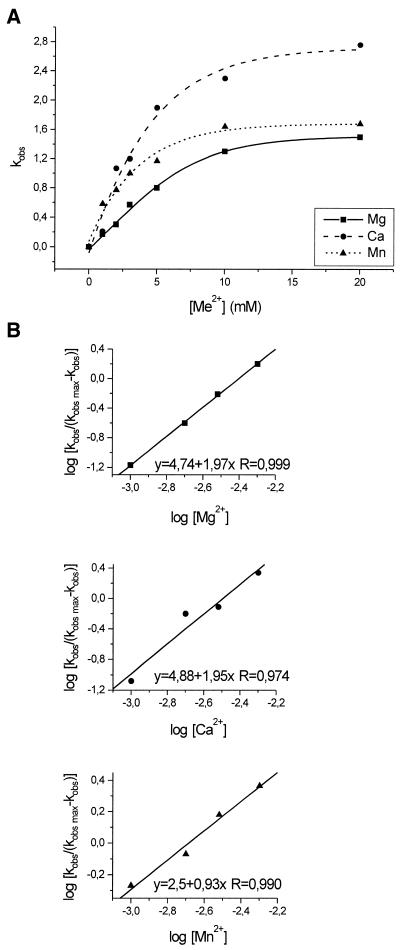
Figure 3.
Dependence of the cleavage rate constants kobs for the trans(S2) ribozyme on the concentration of Mg2+, Ca2+ and Mn2+ ions (A) and Hill analysis of the data (B). The correlation coefficients R were calculated during the least squares regression analysis using the Microcal Origin 5.0 computer program.

