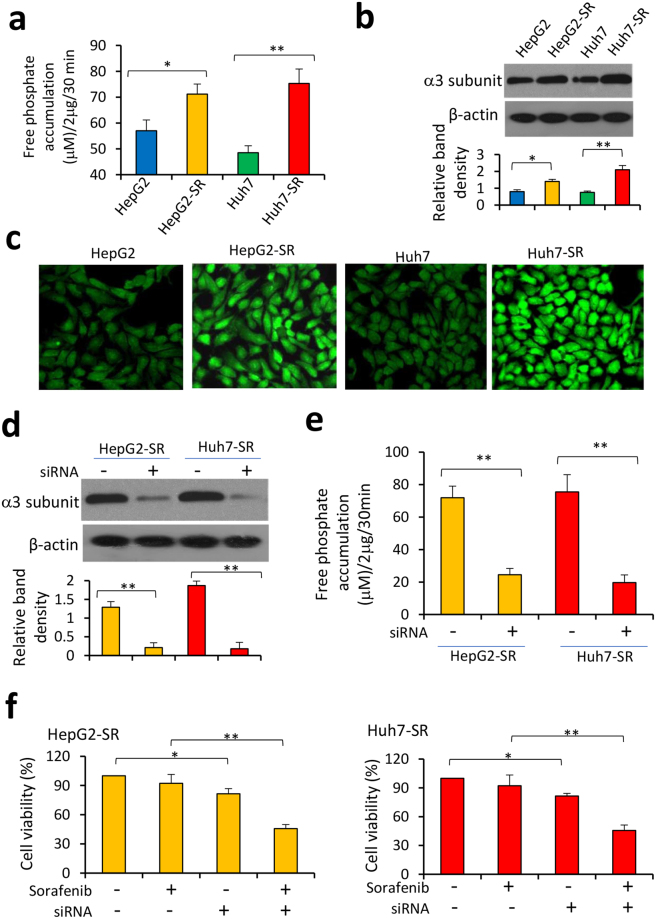
Figure 1.
Increased ATPase activity contributes to sorafenib resistance of HCC cells. (a) HepG2, HepG2-SR, Huh7 and Huh7-SR cells were lysed for measuring ATPase activity, which was represented by the amount of phosphate release from cells by using malachite green reagent. (b,c) The expression of Na+/K+-ATPase α3 subunit protein in the above cells was detected by immunoblotting (b) and immunocytochemistry (c). (d,e) HepG2-SR and Huh7-SR cells were transfected with control siRNA or siRNA targeting the α3 subunit. Cells were harvested 48 h later, and then subjected to immunoblotting (d) and ATPase activity assays (e). (f) Cells transfected with control siRNA or siRNA targeting the α3 subunit were incubated for 48 h in the presence or absence of sorafenib (5 μM). Cell viability (%) was measured. The density of each immunoblotting band was normalized to β-actin. “*” Indicates P < 0.05, and “**” P < 0.001.

