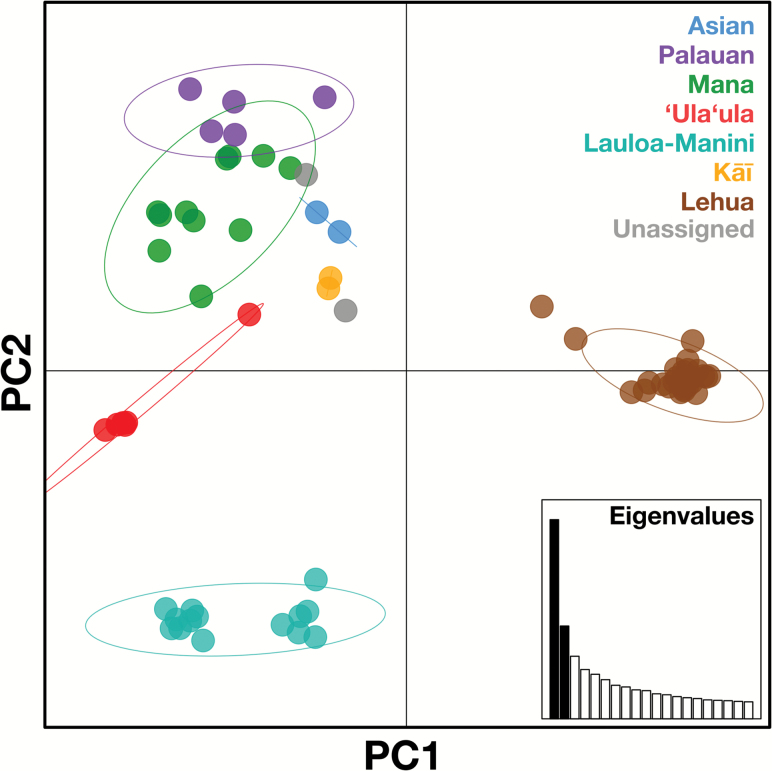
Figure 2.
Principal component analysis (PCA) of 70 taro accessions based on 2447 high-quality SNPs. Strong genetic differentiation is apparent between the Lehua group and all other accessions (first component, 16.3% of variation), and between the Lauloa–Manini group and the remaining accessions (second component, 7.6% of variation). Colors highlight clade membership following Figure 1, with oval outlines indicating 95% inertia ellipses. The inset shows the relative eigenvalues of the first 20 principal components, with the represented components in black.

