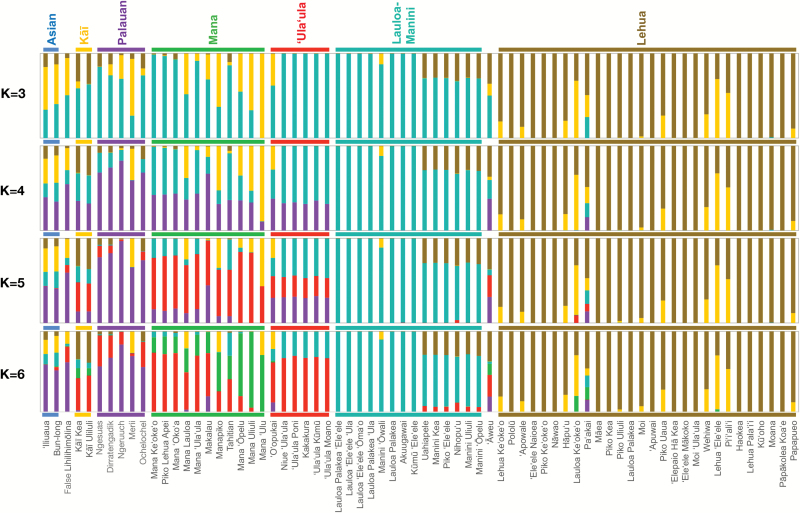
Figure 3.
Population structure analysis assuming admixture and K = 3–6 clusters from top to bottom. Taro accessions are represented by vertical bars, which are partitioned into colored segments representing estimated membership fractions for each cluster. Horizontal bars indicate clade membership according to the phylogenetic analysis (Figure 1). Dominant segments were color-matched to clades when possible.

