Figure 5.
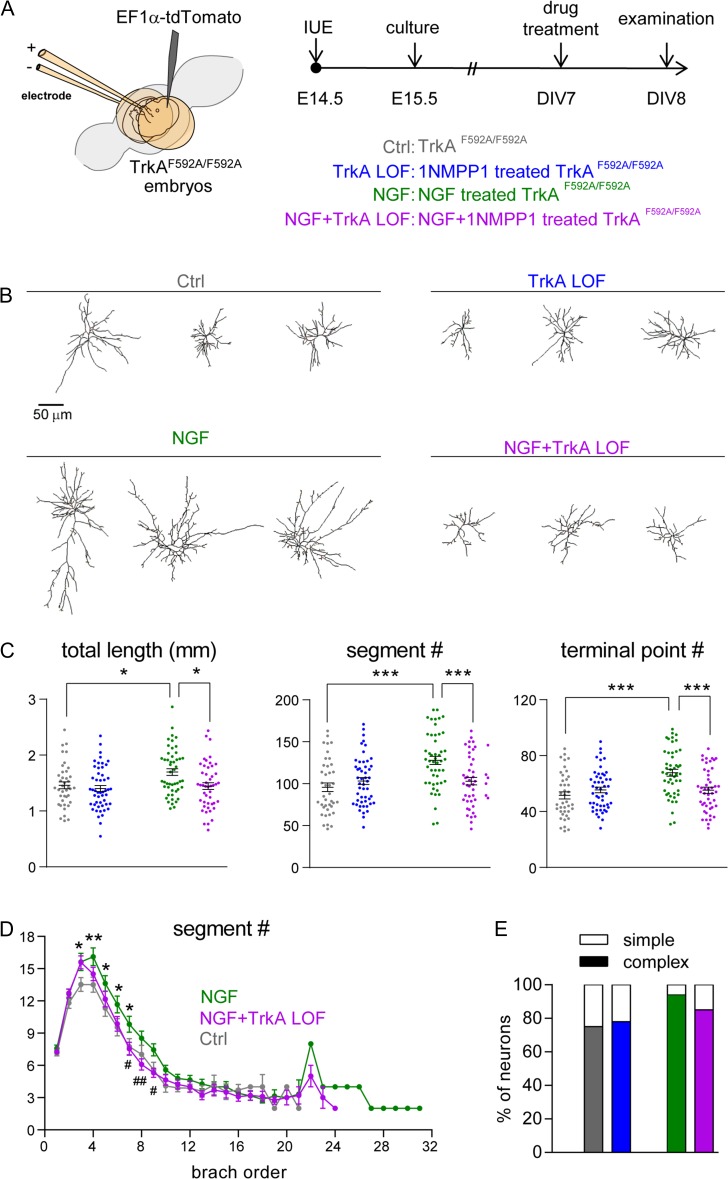
NGF promotes neuronal morphogenesis through TrkA signaling. (A) Schematic representation of the electroporation and culture protocols used to label putative layer IV cortical neurons with tdTomato. NtrKF592A homozygous embryos were electroporated. (B) Representative examples of computer-aided reconstructions. The TrkA inhibitor 1NMPP1 (100 nM) was applied 1 h prior to NGF (100 ng/ml) treatment. (C) Total dendritic length, segment number, and terminal point number are significantly increased in NGF-treated neurons. Treatment with 1NMPP1 attenuated the NGF-induced increase of both measures (NGF+TrkA LOF). Statistical analysis: One-way ANOVA with post hoc Tukey’s multiple comparisons test for (C). The statistical analysis (*) refers to indicated groups compared with each other. *P < 0.05; ***P < 0.001. (D) Summary of segment number per branch order. Mann–Whitney test for (D) to compare segment number per each branch order. The statistical analysis (*) refers to NGF group compared to control (Ctrl) group. *P < 0.05. The statistical analysis (#) refers to NGF group compared to NGF+TrkA LOF group; #P < 0.05; ##P < 0.01. (E) Summary of dendritic complexity by grouping branch order <9 (simple neurons) or branch order ≥9 (complex neurons).

