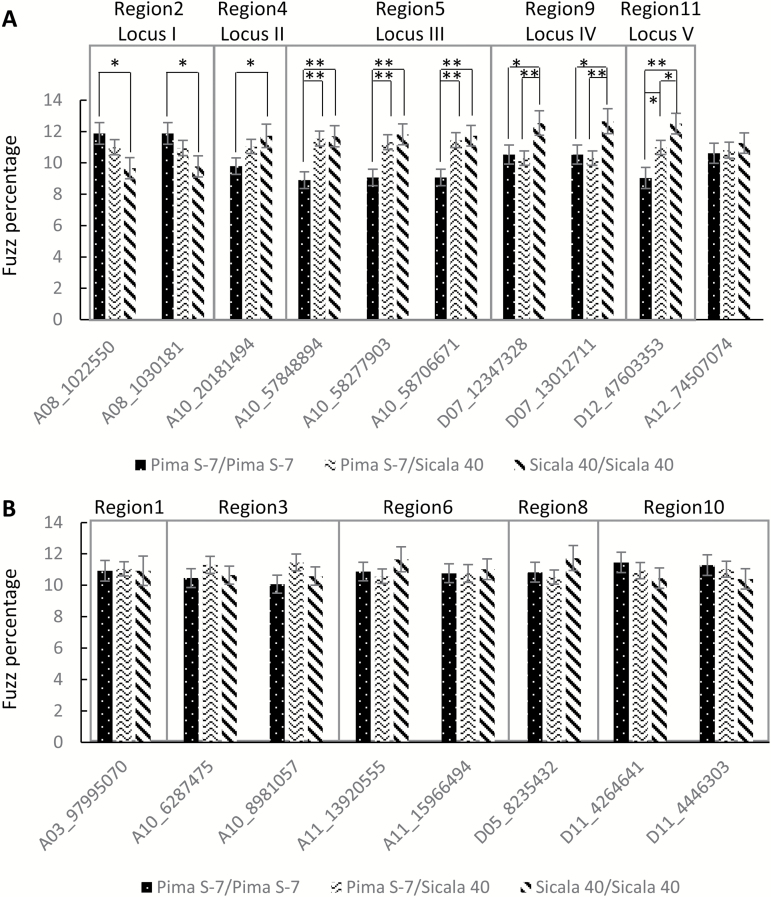
Fig. 3.
Association analysis between SNP markers and fuzz percentages of the PS F2:F3 seeds. F2 plants were genotyped using the markers shown below the x-axis. For each marker, F2 plants were grouped based on their genotypes, i.e. homozygous Pima S-7 (Pima S-7/Pima S-7) or Sicala 40 (Sicala 40/Sicala 40), or heterozygous (Pima S-7/Sicala 40) individuals. Error bars represent standard error. (A) Regions or genetic loci associated with fuzz percentage. Asterisks denote significant difference determined by Student’s t-test: *P<0.05, **P<0.01. A12_74507074 was a randomly selected SNP marker and used as a negative control. (B) Regions not associated with fuzz development.

