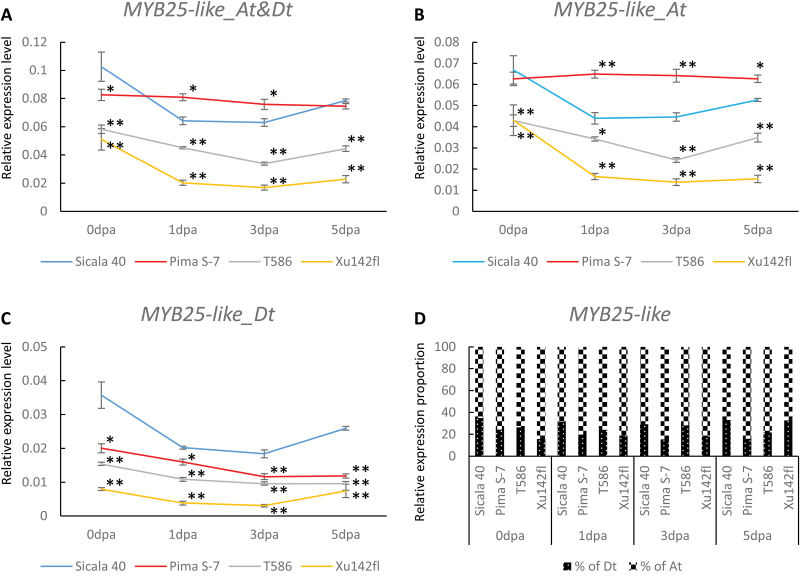
Fig. 5.
Expression profile of MYB25-like in 0–5 dpa whole ovules of four cotton accessions with different fuzz and lint phenotypes. (A) Total expression level of MYB25-like (both homoeologs). (B) Expression level of MYB25-like_At. (C) Expression level of MYB25-like_Dt. Asterisks denote a significant difference compared with the expression level in Sicala 40 determined by one-way ANOVA: *P<0.05, **P<0.01. (D) Relative expression proportion of the At and Dt homoeologs of MYB25-like in 0–5 dpa whole ovules of the same four cotton accessions.

