Fig. 2.
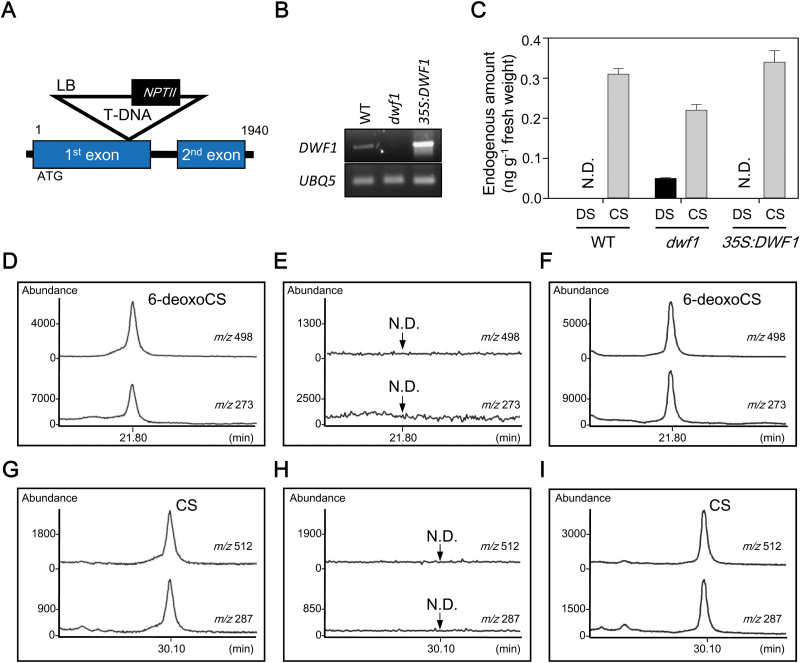
Biochemical analysis of DWF1 enzyme activity as a BR C-24 reductase in Arabidopsis. (A) Schematic diagram of T-DNA insertion in dwf1 mutant. Exons and intron are indicated by boxes and a line, respectively. (B) Semi-qRT-PCR analysis of DWF1 expression in the 40-day-old dwf1 and 35S:DWF1 plants. (C) Endogenous amounts of DS and CS in dwf1, 35S:DWF1, and wild-type (50 g each), which represent the average value obtained from two independent quantitative analyses (+SE). DS was quantified by a GC-SIM-based calibration curve using molecular ion at m/z 510. CS was quantified via GC-SIM using an internal standard (D6-labeled CS). (D–I) In vitro enzymatic conversion of 6-deoxoDS to 6-deoxoCS and DS to CS in wild-type (D, G), dwf1 (E, H), and 35S:DWF1 (F, I). In GC-SIM analysis, ions at m/z 498 (M+) and m/z 273 were monitored for 6-deoxoCS-BMB. Ions at m/z 512 (M+) and m/z 287 were monitored for CS-BMB. N.D., not detected.

