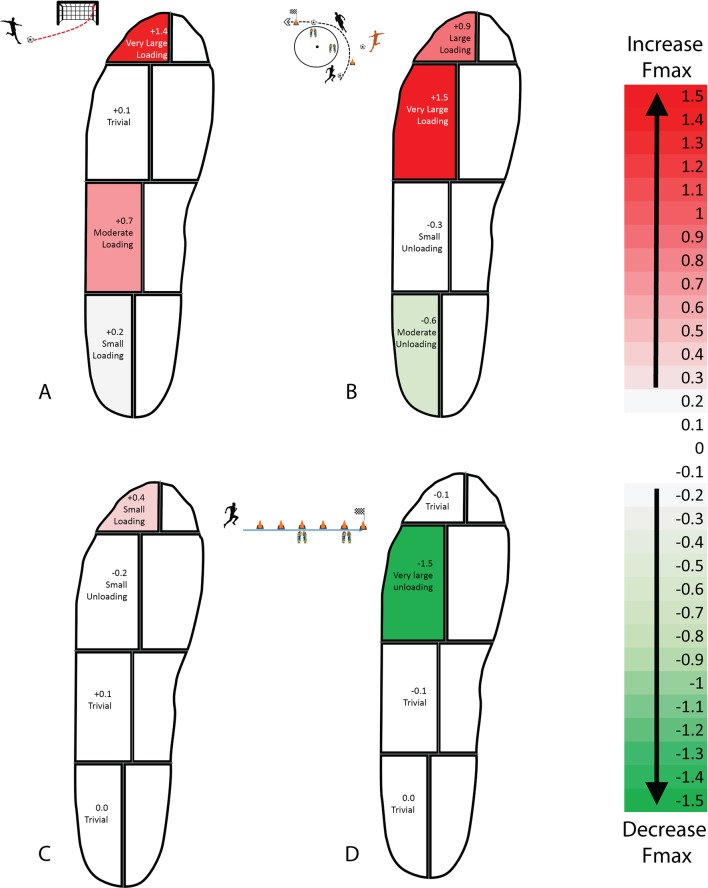
Figure 4.
Between-group differences (MT-5 injured group vs control group) for specific anatomical regions of the foot expressed as effect sizes (Cohen’s d). (A) Set-piece kick. (B) Curved run with ball interplay. (C) Forward straight-line run at 5.5 m s−1. (D) Between-limb difference (within the MT-5 injured group) during a forward straight-line run at 5.5 m s−1.

