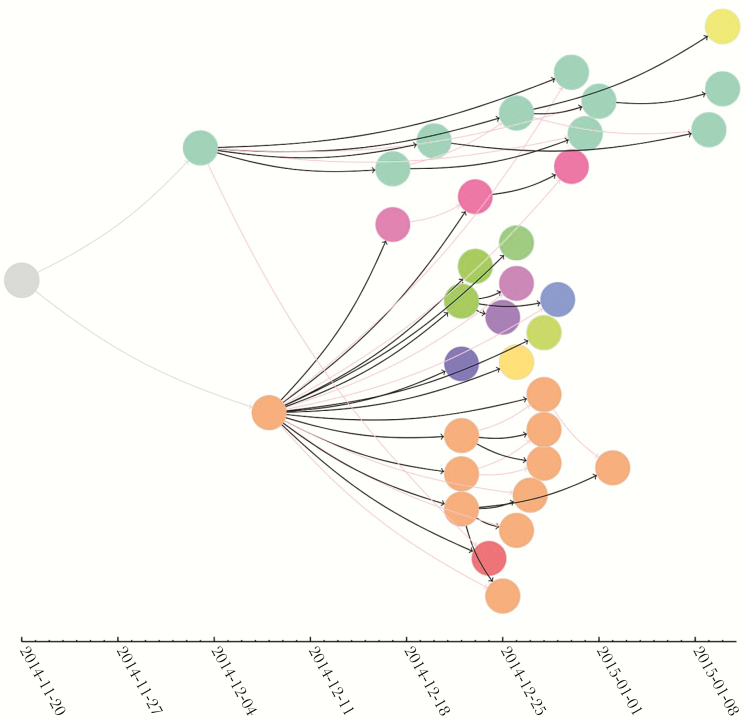
Figure 4.
A temporal representation of the chain of transmission and epidemic curve for Ebola virus disease (EVD) cases. The EVD index case (left: gray circle) in Koidu Town initiated a chain of 34 reported EVD cases in Sukudu. Each circle represents the date of onset of EVD symptoms reported for each reported EVD case. Arrows demonstrate the directionality of the Ebola virus (EBOV) transmission between persons. Solid black arrows represent the primary contact of the EVD case, and red arrows represent secondary contacts. Color describes the households of EVD cases. We excluded the minimally symptomatic EBOV-infected persons and unrecognized EVD cases because they were assumed to be noninfectious or were not asked to recall their date of symptom onset.

