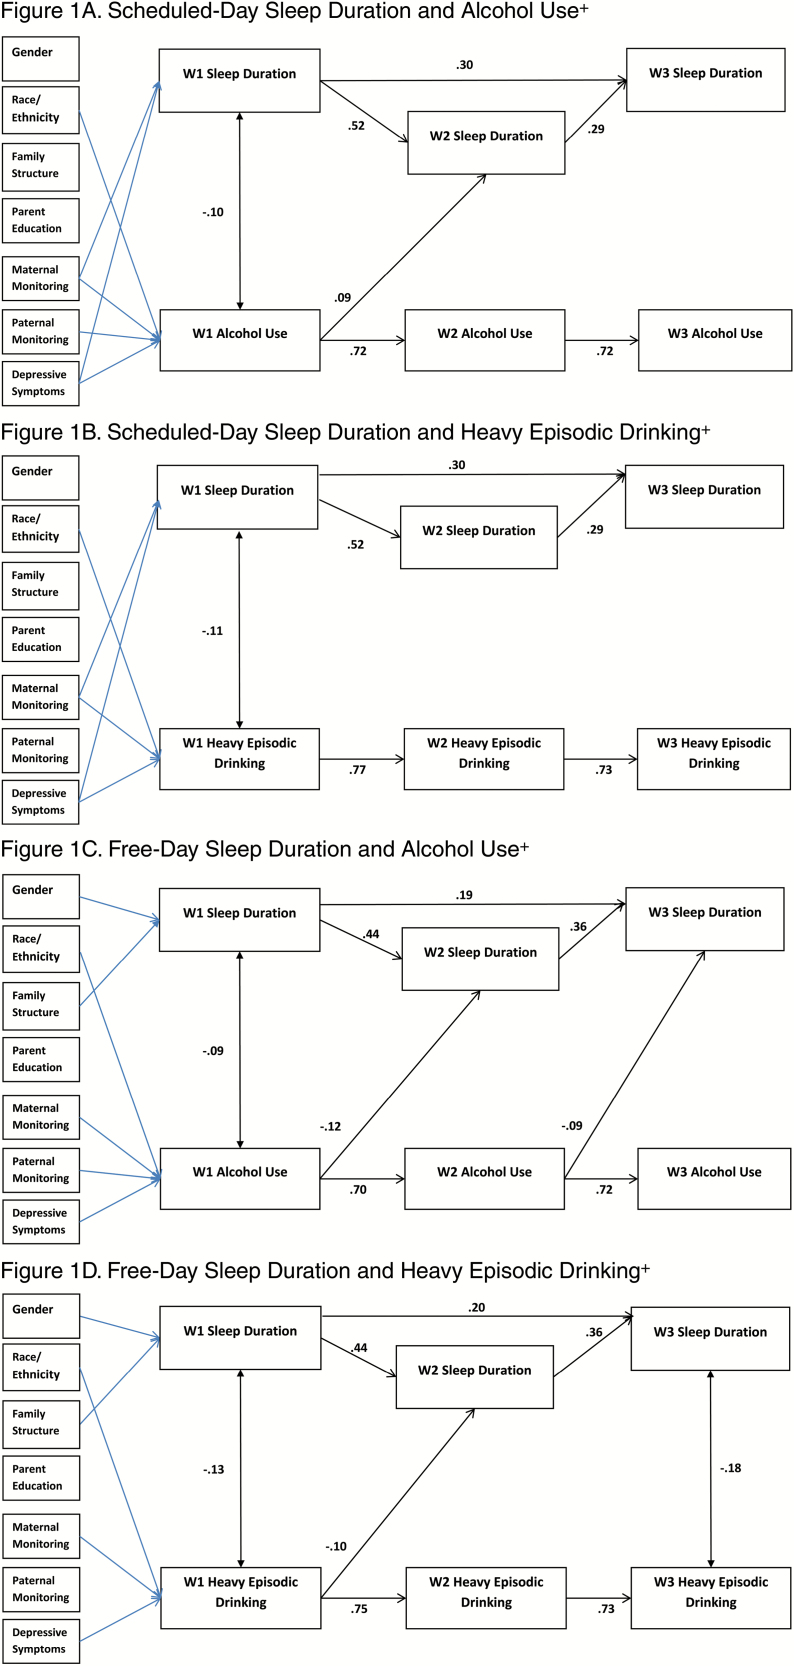
Figure 1.
Significant paths (FDR adjusted) with standardized coefficients. Blue lines indicate significant pathways for covariates. Survey design variables were included in models. +Any use in past 30 days. FDR adjustments: Figure 1A = p ≤ .021, Figure 1B = p ≤ .009, Figure 1C = p ≤ .026, Figure 1D = p ≤ .015.

