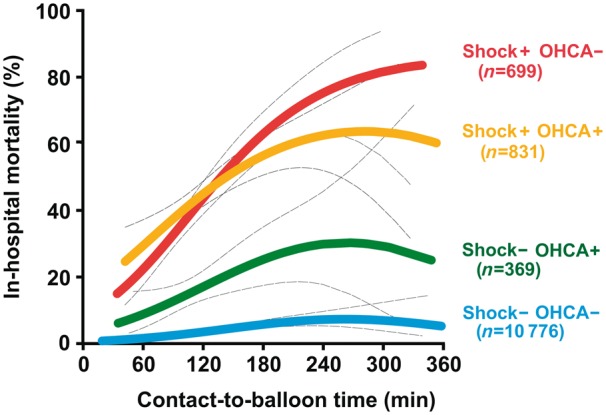
Take home figure.

In-hospital mortality of percutaneous coronary intervention-treated ST-segment elevation myocardial infarction patients by contact-to-balloon time. The figure displays the calculated probabilities of adverse outcome (coloured thick lines) from a logistic regression model with their corresponding 95% confidence intervals (dashes thin black lines) as stratified by the four groups of patients with and without cardiogenic shock (Shock) and out-of-hospital cardiac arrest (OHCA), respectively, including their interaction term.
