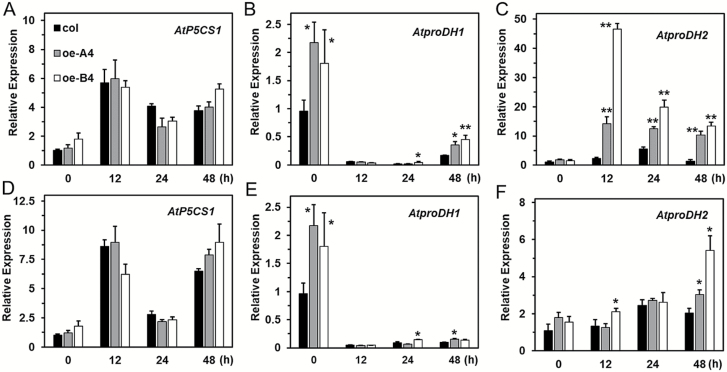
Fig. 10.
Gene expression analysis of AtP5CS1, AtproDH1, and AtproDH2 by qPCR during salt stress. (A–C) Relative expression in the wild-type and transgenic lines after salt treatment in the presence of 2% sucrose, and (D–F) expression in the absence of sucrose. The raw data were normalized by using AtActin2 as an internal reference. Data are means (±SD) of three biological replicates. Significant differences between the wild-type and transgenic plants were determined using Student’s t-test (*P<0.01, **P<0.001).

