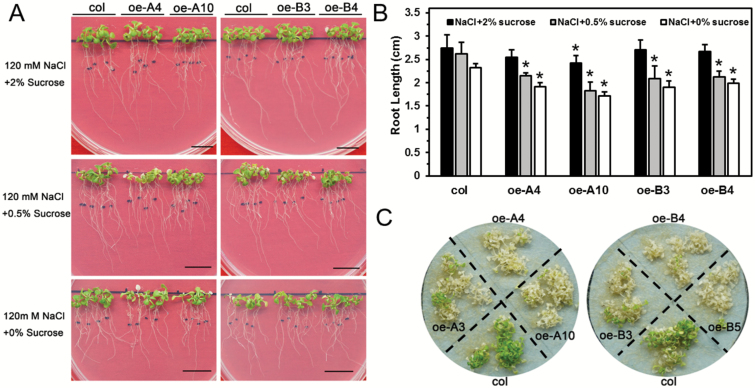
Fig. 6.
Lack of sucrose affected the salt tolerance of transgenic plants. (A) Images of 6-d-old seedlings after 7 d of growth. Scale bars are 1 cm. (B) The root elongation of each plant was measured, and the average value for was determined for each line across three independent experiments (each experiment included 12 plants of each line). Data are means (±SD) of three independent experiments. Significant differences compared with the wild-type were determined using Student’s t-test (*P<0.05). (C) The 10-d-old seedlings were transferred to filter paper and treated with 150 mM NaCl. Images were taken after 7 d. One representative image of three independent experiments is shown (each experiment included at least 30 plants).

