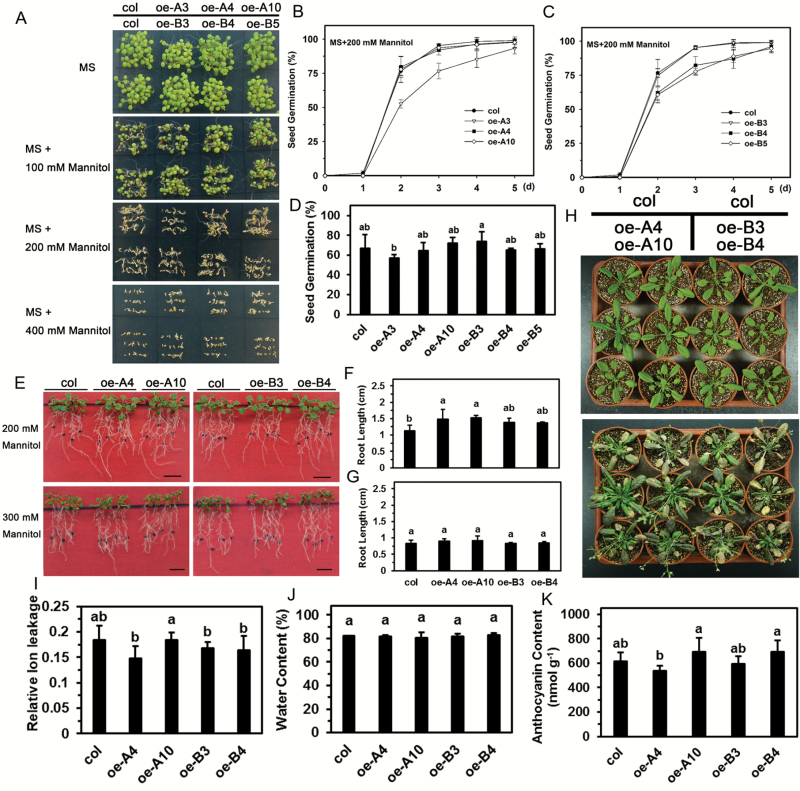
Fig. 7.
Seed germination and seedling growth of transgenic plants in response to mannitol stress. (A) Seed germination with mannitol on plates after 5 d under light. One representative image of three independent experiments is shown (each treatment included at least 30 seeds of each line). (B–D) Seeds were sown on MS medium with 300 mM mannitol and the germination rate was recorded daily. Data are means (±SD) of three independent experiments (more than 30 seeds of each line were tested in each treatment). (E–G) Seedling root growth was measured and after 7 d. One representative image of three independent experiments is shown (each experiment included 12 plants of each line). Data are means (±SD) of three independent experiments. Different letters indicate significant differences among the lines (Student–Newman–Keuls test, P<0.05). (H) Seedlings after treatment with the 400 mM mannitol solution (see Methods for details). One representative image of three independent experiments is shown (each treatment included at least six plants). (I) Relative ion leakage, (J) water content, and (K) anthocyanin content of the leaves of wild-type and transgenic plants after the 400 mM mannitol treatment shown in (H). Data are the means (±SD) of three biological replicates. Different letters indicate significant differences among the lines (Student–Newman–Keuls test, P<0.05).

