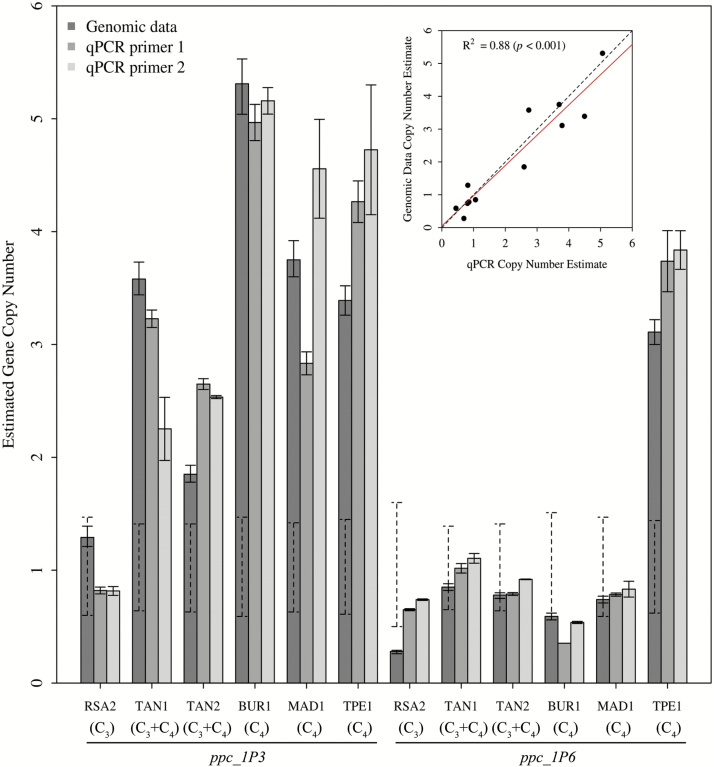
Fig. 3.
Comparison of copy number estimates obtained from qPCR assays and from low-coverage genomic data for the genes ppc_1P3 and ppc_1P6 in six A. semialata accessions. Copy numbers are expressed relative to the ppc_1P7 gene. Error bars are SEs from 2–3 technical replicates for qPCR estimates, and non-parametric error estimates from the GC correction resampling procedure for the genomic estimates of copy number. Dashed lines on the genomic estimates indicate confidence intervals for single-copy genes. The upper panel indicates the correlation between qPCR estimates (mean value of both pairs of primers) and genomic estimates of copy number for ppc_1P3 and ppc_1P6, with the red line being the regression line and the dashed line the identity line.

