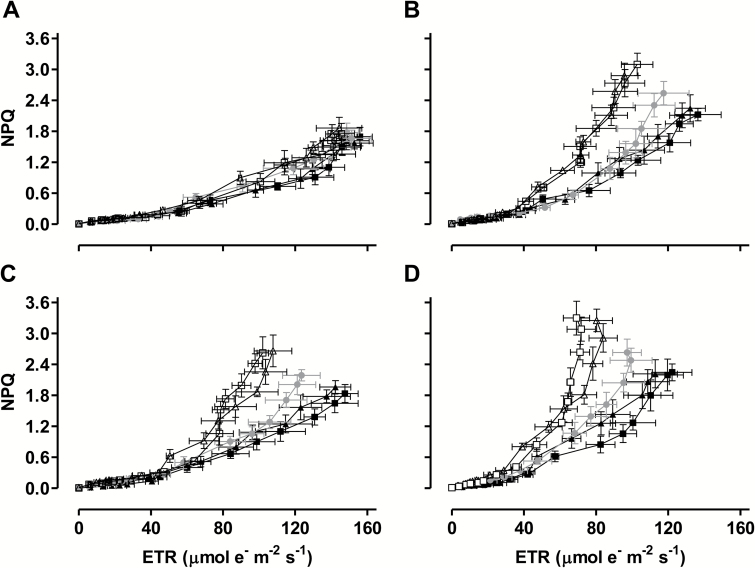
Fig. 3.
The relationship between ETR and NPQ at different times during a prolonged water deficit and measured at the growth irradiance. (A) Day 23. (B) Day 33. (C) Day 39. (D) Day 45. Data are the mean±SE of three independent experiments (n=3). Data are presented for WT (gray circle), AOX overexpressors (B7, closed triangle; B8, closed square), and AOX knockdowns (RI9, open triangle; RI29, open square). ETR and NPQ data for each individual line and over a wide range of measurement irradiances is presented in Supplementary Figs S6 and S7.

