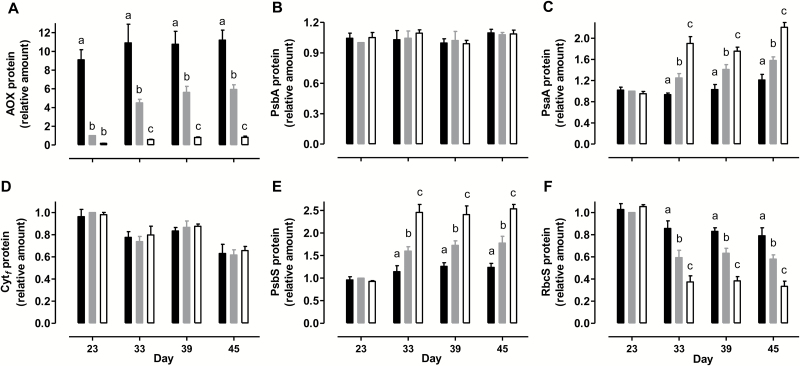
Fig. 6.
Amounts of AOX and different photosynthesis-related proteins in tobacco leaf at different times during a prolonged water deficit. (A) AOX. (B) PsbA. (C) PsaA. (D) Cytf. (E) PsbS. (F) RbcS. Data are presented for WT (gray bar), combined B8 and B7 (closed bar), and combined RI9 and RI29 (open bar). Protein amounts are relative to the amount in the WT on day 23, which was set to 1. Data are the mean±SE of three independent experiments (n=3). Within each data set, plant lines not sharing a common letter are significantly different from one another (P<0.05). In data sets without letters, there are no significant differences across plant lines.

