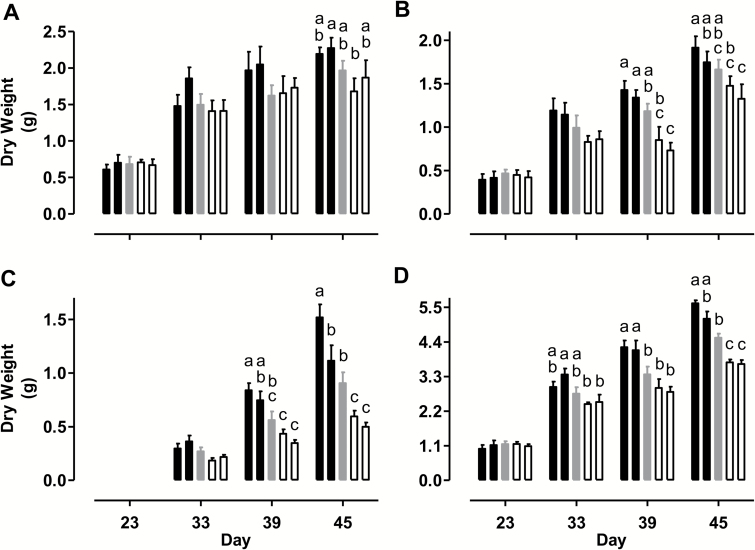
Fig. 7.
Tobacco plant DW at different times during a prolonged water deficit. Data are shown for (A) leaves, (B) stem, (C) reproductive tissue (flowers, seed pods) and (D) total shoot [sum of (A–C)]. Data are presented for WT (gray bar), AOX overexpressors (B8, left closed bar; B7, right closed bar), and AOX knockdowns (RI9, left open bar; RI29, right open bar). Data are the mean±SE of three independent experiments (n=3). Within each data set, plant lines not sharing a common letter are significantly different from one another (P<0.05). In data sets without letters, there are no significant differences across plant lines.

