Fig. 2.

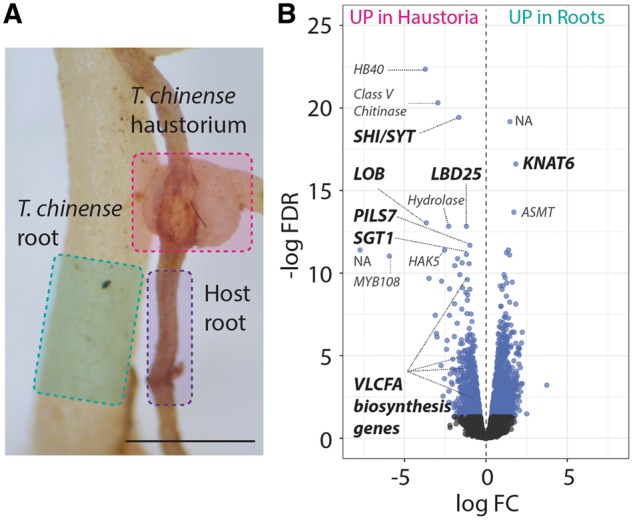
Transcriptomic change in T. chinense haustorial formation. (A) Tissues from T. chinense haustorium and root regions were analyzed and are highlighted by pink and green, respectively. To remove host contamination using bioinformatics, the host root highlighted in purple was also analyzed. The detailed bioinformatics pipeline is shown in Supplementary Fig. S1. (B) Volcano plot showing the differentially expressed transcripts between T. chinense haustoria and roots. The logarithms of the fold change (log FC) of individual genes are plotted against the negative logarithm of their FDR. Negative log FC values represent up-regulation in haustoria, and positive values represent up-regulation in roots. Blue dots represent differentially expressed genes between haustoria and roots with an FDR <0.05. The most significantly up-regulated genes, as well as VLCFA biosynthesis genes, are shown. UP in haustoria, up-regulated in haustoria; UP in roots, up-regulated in roots.
