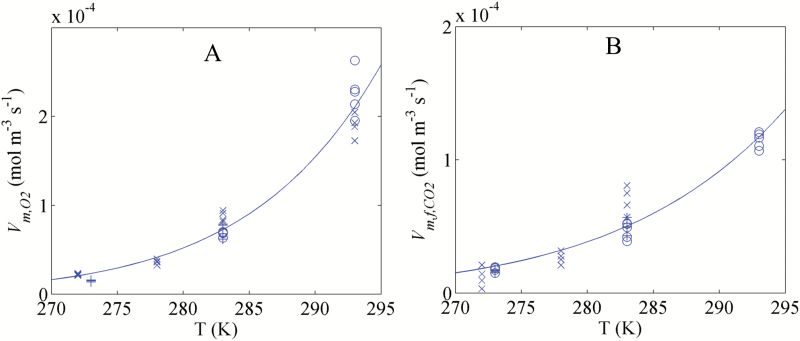
Fig. 2.
Temperature dependency of the maximal O2 consumption rate (A) and the maximal fermentative CO2 production rate (B). Symbols indicate the measurements, while lines present the Arrhenius model. Symbols (+), (open circles) and (×) indicate the measurements in 2010, 2014, and 2016, respectively.

