Fig. 1.
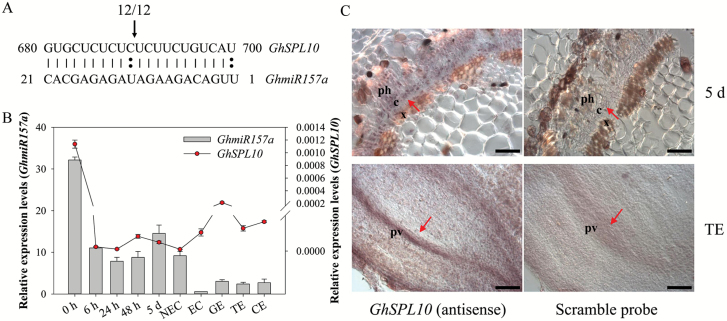
5′-RACE verification of GhmiR157a-guided cleavage site on GhSPL10 mRNA and expression patterns of GhmiR157a and GhSPL10 during cotton SE. (A) Cleavage site from the 5′ end for GhSPL10 by GhmiR157a. The top strand depicts the mRNA fragment of GhSPL10 complementary with GhmiR157a, and the bottom strand depicts GhmiR157a nucleotide sequence. Watson–Crick pairing (vertical dashes) and mismatches (double circles) are indicated. Cleavage site is indicated by the arrow, and the proportion of cloned 5′-RACE products corresponding to the cleavage site is indicated above the arrow. (B) qRT-PCR of GhmiR157a and GhSPL10 during cotton SE. The left y-axis refers to the relative expression levels of GhmiR157a shown as grey bars, and the right y-axis refers to the relative expression levels of GhSPL10 shown as red circles. Relative expression values are normalized to UBQ7. Values represent the mean and standard error (n=3). (C) Whole mount in situ localization of GhSPL10 transcripts in explants cultured for 5 d (top) and torpedo-stage embryo (bottom) detected with GhSPL10 antisense probe (left) or scramble DNA probe (right) as negative control. The red arrows indicate the cambium cells in 5 d explants (top) and provascular tissue in torpedo-stage embryo (bottom). Scale bars=50 µm. c: cambium cells; ph: phloem cells; pv: provascular tissue; x: xylem cells. (This figure is available in color at JXB online.)

