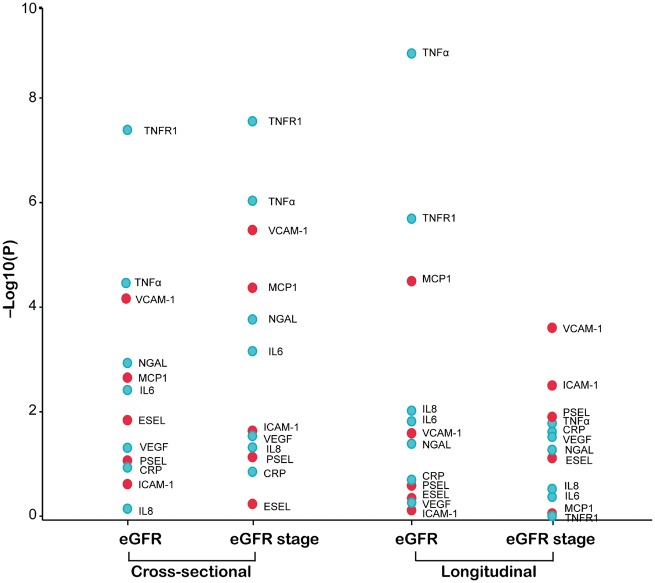
FIGURE 2.
–Log10(P) probability plot of the multivariable-adjusted associations of eGFR (continuous or categorical) with the baseline biomarkers. In categorical analyses, eGFR <60 and ≥60 mL/min/1.73 m2 were contrasted. All analyses were adjusted for mean arterial pressure, waist:hip ratio, smoking, plasma glucose, γ-glutamyltransferase, total:HDL cholesterol ratio, 24-h microalbuminuria and use of diuretics, inhibitors of the renin–angiotensin system (β-blockers, ACE inhibitors and angiotensin type 1 receptor blockers), vasodilators (calcium channel blockers and α-blockers), lipid-lowering drugs and biomarker at baseline. The longitudinal analyses were additionally adjusted for follow-up duration.

