
Figure EV2. Correlating protein to mRNA and proteins per mRNA ratios.
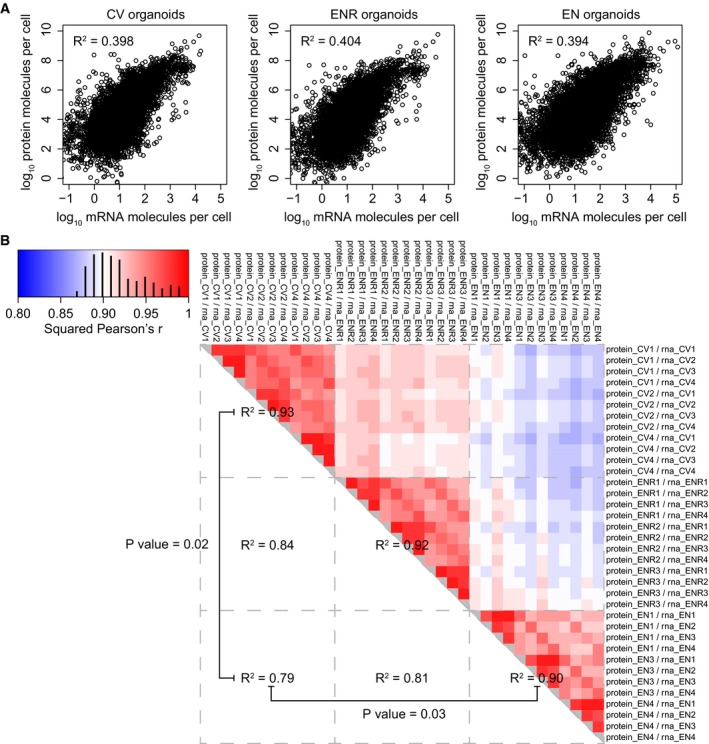
- Scatterplots showing the correlation between the proteome and transcriptome in the different organoid cultures.
- Correlation heatmap of the protein copies per mRNA molecule ratios for all different replicates. Test for significant difference between technical and biological variation was done with a t‐test on the Fisher‐transformed Pearson correlations.