
Figure EV3. Hnf4g dynamics and importance in the different cell‐type‐enriched organoids.
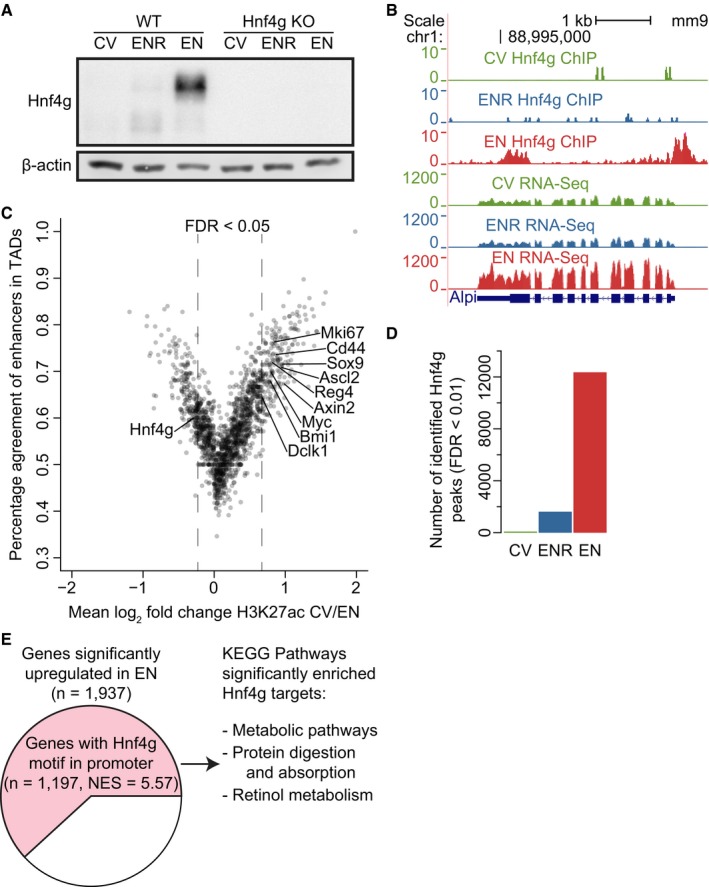
- Western blot for Hnf4g on whole cell extract of CV, ENR, and EN cultured WT and Hnf4g KO organoids. β‐Actin is used as a loading control.
- ChIP‐seq and RNA‐seq profiles of CV, ENR, and EN WT organoids at the Alpi locus.
- Scatterplot showing the percentage of peaks inside a TAD that have fold change in H3K27ac signal in the same direction as the average fold change in H3K27ac of the whole TAD. Striped line demarcates the empirical 0.05 FDR cutoff. Significantly changing TADs that contain a known marker of intestinal homeostasis are highlighted.
- Number of identified peaks of the Hnf4g ChIP‐seq in the different cell‐type‐enriched WT organoids.
- Pie chart showing all significantly upregulated genes in EN organoids. Genes with a Hnf4g motif in their promoter are highlighted in pink. Normalized enrichment score (NES) and motif association were determined in iRegulon (Janky et al, 2014). KEGG pathways that were significantly overrepresented (FDR < 0.01) in upregulated genes with a Hnf4g motif are listed.