
Figure 4. Hnf4g drives differentiation of enterocytes.
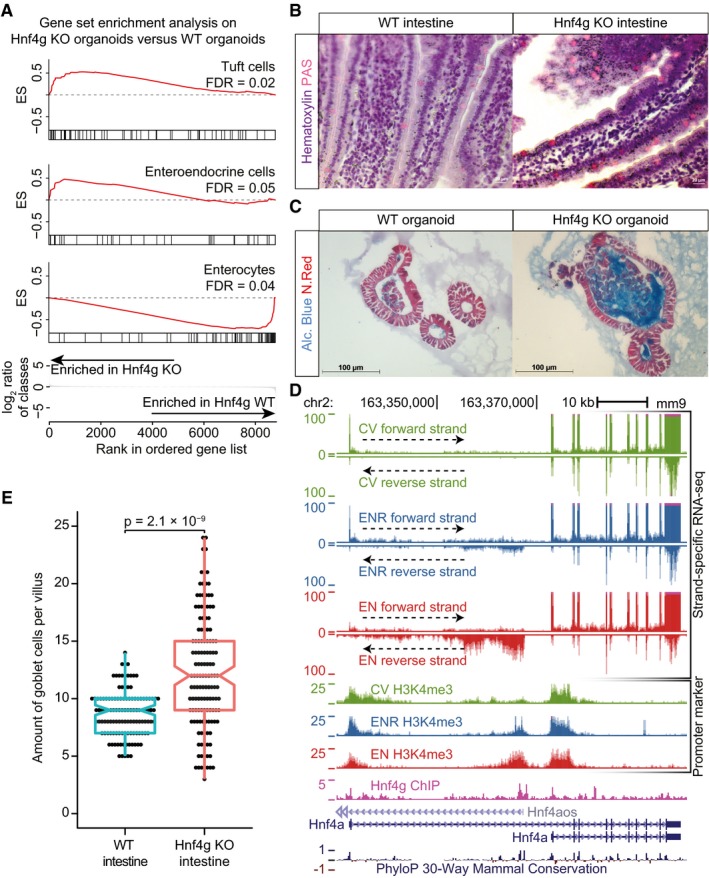
- Gene Set Enrichment Analysis (GSEA) of Hnf4g KO organoids compared to WT organoids. Significantly changing intestinal cell‐type gene sets from Haber et al (2017) are shown (FDR < 0.05).
- Hematoxylin and PAS (periodic acid–Schiff) staining of WT (left) and Hnf4g KO (right) intestine. Nuclei are visualized using hematoxylin and goblet cells stain positive for PAS.
- Alcian Blue and Nuclear Fast Red staining of WT (left) and Hnf4g KO (right) small intestinal organoids. Cells are visualized using Nuclear Fast Red. Intra‐ and extracellular mucus that is produced in goblet cells stain positive for Alcian blue.
- Strand‐specific RNA‐seq data, Hnf4g ChIP‐seq in EN, and promoter‐specific histone modification H3K4me3 over the Hnf4a locus are shown. Data from different organoid cultures are color‐coded. RNA‐seq reads mapping to the positive strand (sense strand) are plotted in the top window of every sample, while RNA‐seq reads that map to the negative strand are mirrored and shown in the bottom window of every sample. The two isoforms of Hnf4a that are expressed are shown in the bottom, together with the antisense transcript Hnf4aos. The “phyloP30way” track from the UCSC genome browser is plotted at the bottom to show sequence conservation.
- Quantification of the amount of goblet cells per villus for WT and Hnf4g KO intestine. Dots represent the amount of goblet cells counted per villus. (n = 7–25 villi from 11 WT mice and 3–17 villi from 14 Hnf4g KO mice). P‐value is from two‐tailed Mann–Whitney U‐test. The central line in each boxplot represents the median, the notch around this line is the approximate 95% confidence interval, the hinges are the first and third quartile, and the whiskers extend to the lowest and highest values within 1.5× the interquartile range from the hinges.