
Figure EV4. Hnf4g importance in human colon cancer organoids and regulation of the Hnf4a locus.
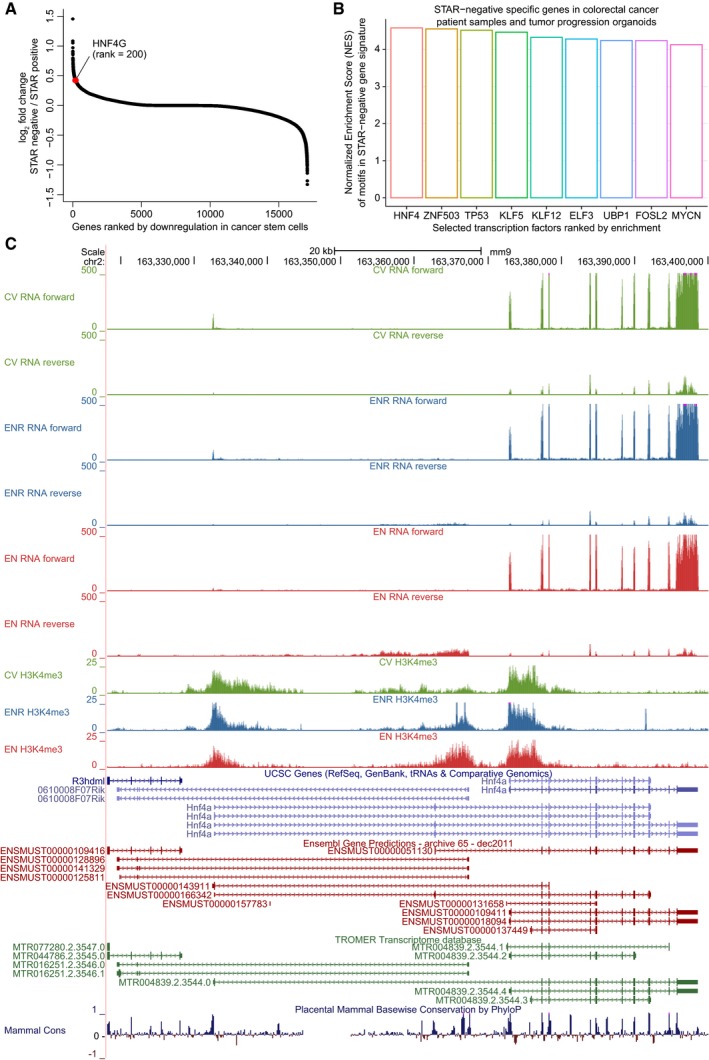
- S‐curve scatterplot with genes ranked by their average fold changes between STem cell Ascl2 Reporter (STAR) negative over STAR positive is plotted. HNF4G is highlighted in red. Average fold change is calculated from the colorectal tumor progression models and colorectal cancer patients reported in Oost et al (2018).
- Transcription factors ranked by their normalized enrichment score in the promoters of significantly downregulated genes (P < 0.001) in the STAR‐positive samples from (A) were shown. Normalized enrichment score (NES) and motif association were determined in iRegulon (Janky et al, 2014).
- Genome browser windows over the complete Hnf4a locus showing all data and all used transcript databases.