
Figure EV5. Comparing histone profiles and DNA accessibility of secretory and enterocyte progenitor cells.
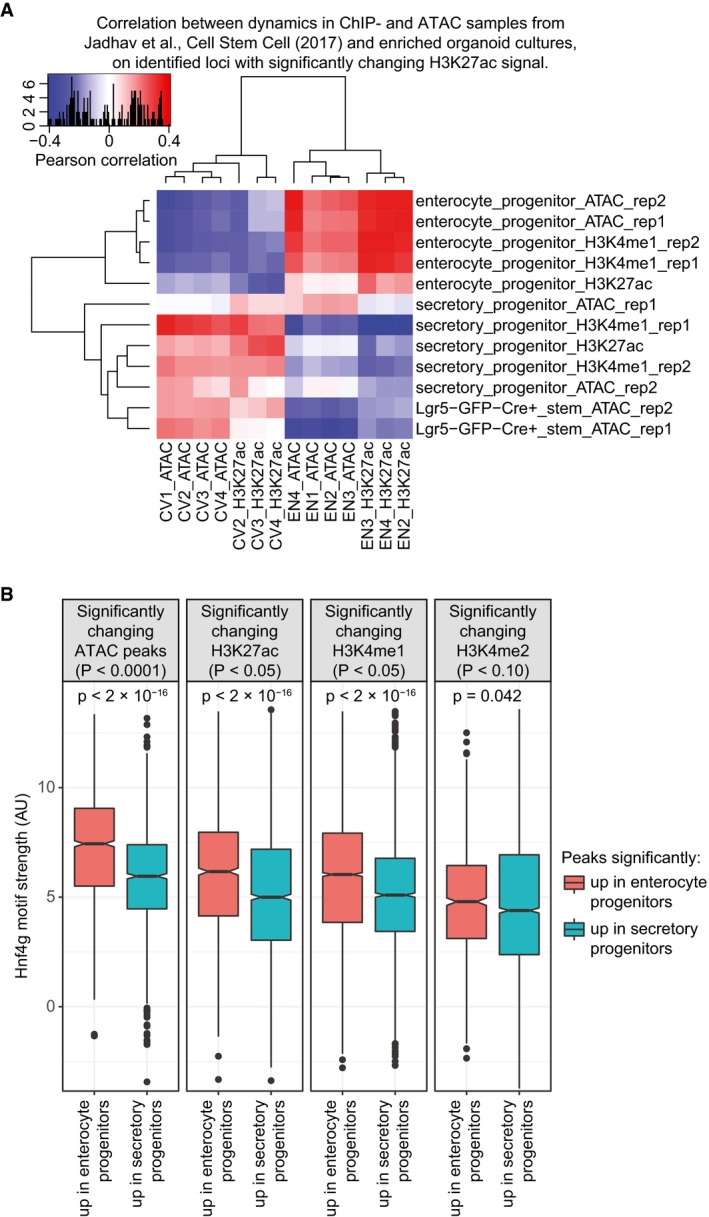
- Correlation heatmap comparing histone profiles and ATAC data from Jadhav et al (2017) to DNA accessibility and H3K27ac profiles of cell‐type‐enriched organoid cultures. Relative changes between CV and EN on significantly changing H3K27ac peaks were correlated to relative changes at the same sites between samples from each dataset of Jadhav et al (2017).
- Significantly changing sites between enterocyte and secretory progenitors were identified with the shown P‐value threshold, and split in enterocyte or secretory‐specific groups. Boxplot with the best HNF4 binding motif scores in enterocyte progenitor and secretory progenitor specific sites were plotted for each dataset. P‐values comparing boxes are determined by two‐tailed Mann–Whitney U‐test. The central line in each boxplot represents the median, the notch around this line is the approximate 95% confidence interval, the hinges are the first and third quartile, and the whiskers extend to the lowest and highest values within 1.5× the interquartile range from the hinges.